Unlock a world of possibilities! Login now and discover the exclusive benefits awaiting you.
- Qlik Community
- :
- All Forums
- :
- QlikView App Dev
- :
- Relabelling Class Function Groups
- Subscribe to RSS Feed
- Mark Topic as New
- Mark Topic as Read
- Float this Topic for Current User
- Bookmark
- Subscribe
- Mute
- Printer Friendly Page
- Mark as New
- Bookmark
- Subscribe
- Mute
- Subscribe to RSS Feed
- Permalink
- Report Inappropriate Content
Relabelling Class Function Groups
Hoping someone can help. I've used the class function to group ages to produce a bar chart. However, the labels on the X axis are not very clear as to what they refer (e.g. 20 <= 21 < rather than 20 to 29.). The calculated dimension looks like this - =Class(Age,10,Age). I've seen where some have added text boxes to cover up the labels, but is there a way of actually customising the labels?
Any help would be much appreciated.
Matt
- « Previous Replies
-
- 1
- 2
- Next Replies »
Accepted Solutions
- Mark as New
- Bookmark
- Subscribe
- Mute
- Subscribe to RSS Feed
- Permalink
- Report Inappropriate Content
Dear Matt,
Use replace() function for replacing '<= x <' with 'to'.
=Replace(Class(Age,10),'<= x <', 'to')
Regards,
Kiran
- Mark as New
- Bookmark
- Subscribe
- Mute
- Subscribe to RSS Feed
- Permalink
- Report Inappropriate Content
Dear Matt,
Use replace() function for replacing '<= x <' with 'to'.
=Replace(Class(Age,10),'<= x <', 'to')
Regards,
Kiran
- Mark as New
- Bookmark
- Subscribe
- Mute
- Subscribe to RSS Feed
- Permalink
- Report Inappropriate Content
You can wrap the result in a replace() function to get what you want . Replace '<=x <' with something better like to
replace( Class(Age,10,Age) , '<= x <' , 'to')

- Mark as New
- Bookmark
- Subscribe
- Mute
- Subscribe to RSS Feed
- Permalink
- Report Inappropriate Content
Hi Matt,
Try using the Replace function, in the format:
Replace(Class(....), '<= x <', ' to ') - this should replace the standard text a class bin width uses with your "to".
- Mark as New
- Bookmark
- Subscribe
- Mute
- Subscribe to RSS Feed
- Permalink
- Report Inappropriate Content
hi have a look at the attach example
simple replace function will do the trick
- Mark as New
- Bookmark
- Subscribe
- Mute
- Subscribe to RSS Feed
- Permalink
- Report Inappropriate Content
Thanks Kiran (and everyone else too). Works a treat! The only thing I've noticed though is that age groupings overlap e.g. 20 to 30 (which doesn't feature anyone aged 30), 30 to 40 (which does feature those aged 30 but no one aged 40). Is there anyway to tweak this so there is no overlap e.g 20 to 29, 30 to 39?
Any help would be much appreciated.
Matt
- Mark as New
- Bookmark
- Subscribe
- Mute
- Subscribe to RSS Feed
- Permalink
- Report Inappropriate Content
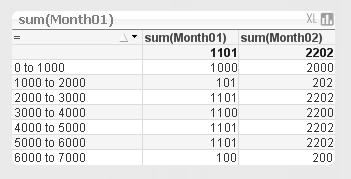
I played around a bit more. Here is a full customization that seems to work. I'm doing a '-1' at the end of the 2nd value to reduce it by one notch. Does it help ?
=
left( Class( Sales, 1000), findoneof( Class( Sales, 1000),' ',1))
& ' to ' &
( Num(mid( Class( Sales, 1000), findoneof( Class( Sales, 1000),' ',4)))-1)
- Mark as New
- Bookmark
- Subscribe
- Mute
- Subscribe to RSS Feed
- Permalink
- Report Inappropriate Content
Perfect Jonathan! Works a treat ![]() Many thanks everyone!
Many thanks everyone!
Matt
- Mark as New
- Bookmark
- Subscribe
- Mute
- Subscribe to RSS Feed
- Permalink
- Report Inappropriate Content
Yes ! sorry i posted the example from my own data you are correct
everything else is right. the first space denotes the end of the first number, the 4th space denotes the start of the 2nd number...thats the key for the findoneof() function.
number <= x < 2ndnumber
- Mark as New
- Bookmark
- Subscribe
- Mute
- Subscribe to RSS Feed
- Permalink
- Report Inappropriate Content
Ah, one slight fly in the ointment. Whilst it has sorted the groupings, it now features an empty first grouping of <blank> to <blank> with no values. I'm assuming its trying to group 0-9. Is there an easy way of hiding this empty grouping?
- « Previous Replies
-
- 1
- 2
- Next Replies »