Unlock a world of possibilities! Login now and discover the exclusive benefits awaiting you.
- Qlik Community
- :
- All Forums
- :
- QlikView App Dev
- :
- Re: Removing Junk Data and Files from Chart
- Subscribe to RSS Feed
- Mark Topic as New
- Mark Topic as Read
- Float this Topic for Current User
- Bookmark
- Subscribe
- Mute
- Printer Friendly Page
- Mark as New
- Bookmark
- Subscribe
- Mute
- Subscribe to RSS Feed
- Permalink
- Report Inappropriate Content
Removing Junk Data and Files from Chart
Hello All,
I have a query with regard to cleaning up the data received before any operation is carried out on it.
Currently, the raw data has a lot of junk values that is not required for analysis. (Due to delayed/incorrect sensor measurements). Please refer below screenshot: (Multiple graphs are plotted on a single chart)
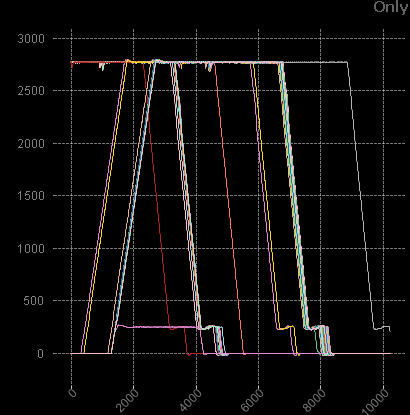
All values present below 1800 and all values above 8500 on the x-axis are considered junk. My intention is to remove these values out completely i.e. using a button: When it's pressed, all files containing these junk data ranges must be removed from the graph and therefore, we would have a cleaner graph to carry out analysis.
I could only use a conditional statement like: if( [Y1]<8500 or [Y1]>1500, Only(Y1)). But, it only deletes a small range of the values.and the remaining data Information of that file is still present on the plot.
Does anyone have any ideas with regard to implementing the above objective?
Have attached sample files for your reference.
Thanks
- Mark as New
- Bookmark
- Subscribe
- Mute
- Subscribe to RSS Feed
- Permalink
- Report Inappropriate Content
Can anyone support with a suitable solution to resolve this query?
- Mark as New
- Bookmark
- Subscribe
- Mute
- Subscribe to RSS Feed
- Permalink
- Report Inappropriate Content
Where you want to implement that logic in front end or back end
Easiest way is at back end
Back End
Load * from File
where Y1<8500 and Y1> 1500;
Front end
In chart expression
sum({<Y1={">1500<8500"}>}Y1)
Regards,
- Mark as New
- Bookmark
- Subscribe
- Mute
- Subscribe to RSS Feed
- Permalink
- Report Inappropriate Content
Make a separate chart which can be activated through button
and Now put expression that removes junk value in chart
when u'll click the button, without junk chart will be activated.
- Mark as New
- Bookmark
- Subscribe
- Mute
- Subscribe to RSS Feed
- Permalink
- Report Inappropriate Content
i think it's not possible directly what u r looking for,but u can work around by creating two charts with button the same solution(chat 1 with full data and chat 2 with restricted data)
- Mark as New
- Bookmark
- Subscribe
- Mute
- Subscribe to RSS Feed
- Permalink
- Report Inappropriate Content
Hello Max,
Thanks for your reply 
However, it was not what I require. Perhaps I needed to explain my problem statement more clearly.
Your suggestion only considers removing the data for all values in Y1 that lie outside the (1500, 8500) range. However, I require the below action to be taken on the graph:
Remove the data for which ((X < 1500 OR X > 8500) AND (Corresponding Y1 value at that point on the X-axis is NOT equal to zero)) and furthermore, also remove the files containing this data from the plotted graph and ONLY display those files which have values in the expected range (Here, Between 1500 and 8500)
Any suggestions to implement the above logic?
Please let me know if any further information or clarification is required with regard to the same.
Regards,
Suraj
Note:
In my backend, the script imports multiple files from a Folder without using the * Operator.
SImilar to the technique in below link:
- Mark as New
- Bookmark
- Subscribe
- Mute
- Subscribe to RSS Feed
- Permalink
- Report Inappropriate Content
Hello Shiva,
Do you mean creating a button to swap between charts? Where, for instance, Chart 1 is hidden and only Chart 2 (Containing filtered data) is displayed when the button is pressed.
Furthermore, any suggestions for implementing the graph with the restricted data?
Regards,
Suraj
- Mark as New
- Bookmark
- Subscribe
- Mute
- Subscribe to RSS Feed
- Permalink
- Report Inappropriate Content
yes,correct.
regarding restricted date,write expression with condition.