Unlock a world of possibilities! Login now and discover the exclusive benefits awaiting you.
- Qlik Community
- :
- All Forums
- :
- QlikView App Dev
- :
- Re: Represent NA in a Bar Chart
- Subscribe to RSS Feed
- Mark Topic as New
- Mark Topic as Read
- Float this Topic for Current User
- Bookmark
- Subscribe
- Mute
- Printer Friendly Page
- Mark as New
- Bookmark
- Subscribe
- Mute
- Subscribe to RSS Feed
- Permalink
- Report Inappropriate Content
Represent NA in a Bar Chart
hi there,
Actually i am using a DB where for a column i can have possible values as 0,1 and Blank. I can show sum of these values in a Bar Chart over a dimension. Now the question is I want to show another bar in the same chart that will show NA for blank values on the same dimension.
eg.
Load * inline
[
name,errors
A,2
B,3
A,Blank
]
Can anyone please help me out here..??
Also I have another question. Here i am trying to calculate %share for an individual from same column, so Column NPT has nu. of production hours. When i calculate % for A it will be sum(NPT)/sum(NPT). now the problem is it always show 100% whenever i select a person's name in filter and i understand the reason that it filters out other values as well. Is it possible to store total of NPT column seperatley and then i can use it to calculate percentage share of each individual..? I am trying this on frontend. Any help/suggestion will be appreciated.
eg,
Name,NPT
A,2
B,2
ideally share should be 50% for both but i am getting 100.
Thanks
Sagar
- « Previous Replies
-
- 1
- 2
- Next Replies »
- Mark as New
- Bookmark
- Subscribe
- Mute
- Subscribe to RSS Feed
- Permalink
- Report Inappropriate Content
What are you expecting from given data set
Load * inline [
name,errors
A,2
B,3
A,Blank ];
- Mark as New
- Bookmark
- Subscribe
- Mute
- Subscribe to RSS Feed
- Permalink
- Report Inappropriate Content
Anil I want my chart to represent 3 columns where it should print 2,Blank with A on xaxis and only 3 with B on x axis.
- Mark as New
- Bookmark
- Subscribe
- Mute
- Subscribe to RSS Feed
- Permalink
- Report Inappropriate Content
In chart, 3 columns??? Will you able to draw on paper and share?
- Mark as New
- Bookmark
- Subscribe
- Mute
- Subscribe to RSS Feed
- Permalink
- Report Inappropriate Content
Hi sagar,
blank spaces - no value - in an Excel sheet are a bit tricky to display - you will have to use an auxiliary formula in Excel to display something whenever there is a BLANK in that column - or try to load that with an IF_formula like
>> IF(LEN(TRIM([field])=0, 'A', 'B') <<
in QlikView and then check whether the count is correct - whether all the blank spaces in the column have been correctly identified by QlikView.
HTH
Best regards,
DataNibbler
- Mark as New
- Bookmark
- Subscribe
- Mute
- Subscribe to RSS Feed
- Permalink
- Report Inappropriate Content
@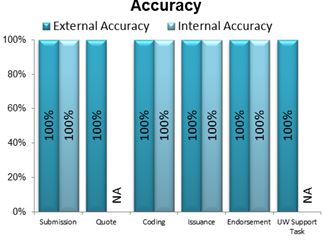
I hope you can relate to this..Where i have values percentages are calculated but where we have blanks for a process it shows NA
- Mark as New
- Bookmark
- Subscribe
- Mute
- Subscribe to RSS Feed
- Permalink
- Report Inappropriate Content
Does it mean, you want to remove NA from above image. i am sorry for that. Will you able to provide sample application
- Mark as New
- Bookmark
- Subscribe
- Mute
- Subscribe to RSS Feed
- Permalink
- Report Inappropriate Content
Anil i want to keep it. As of now i am not able to show NA in bar chart. The chart i have provided above is made in excel not qlikview. o just wanted to show the example.
- Mark as New
- Bookmark
- Subscribe
- Mute
- Subscribe to RSS Feed
- Permalink
- Report Inappropriate Content
Hi Hofmann,
My requirement is to show NA in bar chart..
- Mark as New
- Bookmark
- Subscribe
- Mute
- Subscribe to RSS Feed
- Permalink
- Report Inappropriate Content
Also can you please revert back to my second question..??
"I have another question. Here i am trying to calculate %share for an individual from same column, so Column NPT has nu. of production hours. When i calculate % for A it will be sum(NPT)/sum(NPT). now the problem is it always show 100% whenever i select a person's name in filter and i understand the reason that it filters out other values as well. Is it possible to store total of NPT column seperatley and then i can use it to calculate percentage share of each individual..? I am trying this on frontend. Any help/suggestion will be appreciated."
- « Previous Replies
-
- 1
- 2
- Next Replies »