Unlock a world of possibilities! Login now and discover the exclusive benefits awaiting you.
- Qlik Community
- :
- All Forums
- :
- QlikView App Dev
- :
- Result from month based on previous months
- Subscribe to RSS Feed
- Mark Topic as New
- Mark Topic as Read
- Float this Topic for Current User
- Bookmark
- Subscribe
- Mute
- Printer Friendly Page
- Mark as New
- Bookmark
- Subscribe
- Mute
- Subscribe to RSS Feed
- Permalink
- Report Inappropriate Content
Result from month based on previous months
Hi,
We are struggling with set analysis trying to calculate a result for a specific month based on values from previous months. For sake of simplicity we boiled this down to its essentials.
Consider the following table:
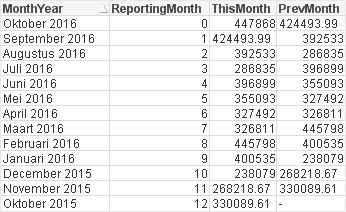
| ReportingMonth | MonthYear | This Month | Prev Month |
| 0 | Oktober 2016 | 447868 | 0 |
| 1 | September 2016 | 424493,99 | 0 |
| 2 | Augustus 2016 | 392533 | 0 |
| 3 | Juli 2016 | 286835 | 0 |
| 4 | Juni 2016 | 396899 | 0 |
| 5 | Mei 2016 | 355093 | 0 |
| 6 | April 2016 | 327492 | 0 |
| 7 | Maart 2016 | 326811 | 0 |
| 8 | Februari 2016 | 445798 | 0 |
| 9 | Januari 2016 | 400535 | 0 |
| 10 | December 2015 | 238079 | 0 |
| 11 | November 2015 | 268218,67 | 0 |
| 12 | Oktober 2015 | 330089,61 | 0 |
In the 'Prev Month' column (where currently only zero's are displayed) we want the value from the next row to appear. We tried doing so using set analysis as follows:
Sum({$<ReportingMonth={"$(=Test2)+1"}>}InvoiceQuantity)
Test2 is a LET variable: LET Test2 = 'ReportingMonth + 1';
The above table should look as follows:
| ReportingMonth | MonthYear | This Month | Prev Month |
| 0 | Oktober 2016 | 447868 | 424493,99 |
| 1 | September 2016 | 424493,99 | 392533 |
| 2 | Augustus 2016 | 392533 | 286835 |
| 3 | Juli 2016 | 286835 | 396899 |
| 4 | Juni 2016 | 396899 | 355093 |
| 5 | Mei 2016 | 355093 | 327492 |
| 6 | April 2016 | 327492 | 326811 |
| 7 | Maart 2016 | 326811 | 445798 |
| 8 | Februari 2016 | 445798 | 400535 |
| 9 | Januari 2016 | 400535 | 238079 |
| 10 | December 2015 | 238079 | 268218,67 |
| 11 | November 2015 | 268218,67 | 330089,61 |
| 12 | Oktober 2015 | 330089,61 | 398637 |
We have gone through a whole bunch of variations as well as through a miriad of posts on the community. No luck and pretty frustrating. So any help will be highly appreciated.
Thanks!
- Tags:
- set analysis
- « Previous Replies
-
- 1
- 2
- Next Replies »
- Mark as New
- Bookmark
- Subscribe
- Mute
- Subscribe to RSS Feed
- Permalink
- Report Inappropriate Content
Hi,
Temp:
Load * Inline [
ReportingMonth, MonthYear, ThisMonth
0, Oktober 2016, 447868
1, September 2016, 424493.99
2, Augustus 2016, 392533
3, Juli 2016, 286835
4, Juni 2016, 396899
5, Mei 2016, 355093
6, April 2016, 327492
7, Maart 2016, 326811
8, Februari 2016, 445798
9, Januari 2016, 400535
10, December 2015, 238079
11, November 2015, 268218.67
12, Oktober 2015, 330089.61
];
Load *,Peek(ThisMonth) as PrevMonth
Resident Temp
Order By ReportingMonth desc;
Drop Table Temp;

Regards,
Antonio
- Mark as New
- Bookmark
- Subscribe
- Mute
- Subscribe to RSS Feed
- Permalink
- Report Inappropriate Content
in a chart expression, use the above or below function.
- Mark as New
- Bookmark
- Subscribe
- Mute
- Subscribe to RSS Feed
- Permalink
- Report Inappropriate Content
I'm sorry, but this is not what we are looking for. We need to aggregate taking filters into account. We cannot calculate these measures during data load.
- Mark as New
- Bookmark
- Subscribe
- Mute
- Subscribe to RSS Feed
- Permalink
- Report Inappropriate Content
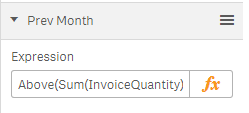
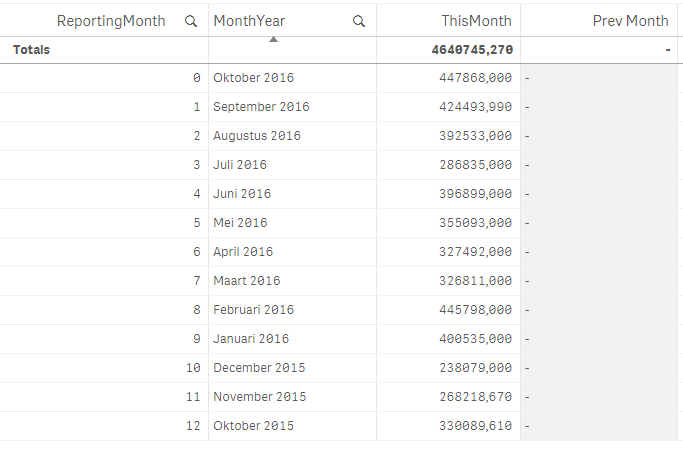
This looks interesting, but for some reason, I'm not able to get this to work. This is the code used, and some screenshots to clarify.
Above(Sum(InvoiceQuantity),1)


- Mark as New
- Bookmark
- Subscribe
- Mute
- Subscribe to RSS Feed
- Permalink
- Report Inappropriate Content
Hi Jeroen, as Ioannis said, you can do it in chart using the below funtion:
Below(Sum(InvoiceQuantity))
The option given by Antonio is also a good one, sometimes is better have the previous values stored in the same row.
As a general comment, you tried yo dinamically use set analysis to filter ReportingMonth based on row values, this can't work because set analysis is applied before the table is calculated, so vTest will return null because it has many different values (row value not affecting). And in case it only has one value, this value will be applied to all rows (the same value)
- Mark as New
- Bookmark
- Subscribe
- Mute
- Subscribe to RSS Feed
- Permalink
- Report Inappropriate Content
Hi Ruben,
I think You need TOTAL in expression
Below(TOTAL Sum(InvoiceQuantity))
Regards,
Antonio
- Mark as New
- Bookmark
- Subscribe
- Mute
- Subscribe to RSS Feed
- Permalink
- Report Inappropriate Content
Hi Ruben ,
The replies we received so far made us realize that we probalbly oversimplified this a little.
- First off in the PrevMonth we actually need to sum the 'ThisMonth' values from the previous 12 months.So for October 2016 we need to calculate the sum of the values for the months September 2016 up until October 2015. This outcome is then used in a subsequent calculation step where is used as a denominator for dividing the Present value (which is the numerator) (but no need to get into those details).
- Second, the user may slice on different dimensions like (product family, customer region, customer, etc...). The resulting measure which we are calculating should honor the filter selections set by the user of course. While it may be possible to calculate and store the sum of the previous 12 months at the atomic grain level it does not feel like an attractive approach.
Hope this helps to clarify a bit more.
Thanks for your help!
- Mark as New
- Bookmark
- Subscribe
- Mute
- Subscribe to RSS Feed
- Permalink
- Report Inappropriate Content
Thanks Antonio, with this answer we are one step closer as we are getting the correct results now. But as we mentioned below, the problem is slightly more complex than this...
Still, thanks for your suggestion!
- Mark as New
- Bookmark
- Subscribe
- Mute
- Subscribe to RSS Feed
- Permalink
- Report Inappropriate Content
We found this post to be very helpful: Accumulative Sums
- « Previous Replies
-
- 1
- 2
- Next Replies »