Unlock a world of possibilities! Login now and discover the exclusive benefits awaiting you.
Woohoo! Qlik Community has won “Best in Class Community” in the 2024
Khoros Kudos awards!
Announcements
Nov. 20th, Qlik Insider - Lakehouses: Driving the Future of Data & AI - PICK A SESSION
- Qlik Community
- :
- All Forums
- :
- QlikView App Dev
- :
- Returning Dimension Value that AGGR() Aggregated o...
Options
- Subscribe to RSS Feed
- Mark Topic as New
- Mark Topic as Read
- Float this Topic for Current User
- Bookmark
- Subscribe
- Mute
- Printer Friendly Page
Turn on suggestions
Auto-suggest helps you quickly narrow down your search results by suggesting possible matches as you type.
Showing results for
Creator III
2016-11-02
01:26 PM
- Mark as New
- Bookmark
- Subscribe
- Mute
- Subscribe to RSS Feed
- Permalink
- Report Inappropriate Content
Returning Dimension Value that AGGR() Aggregated over
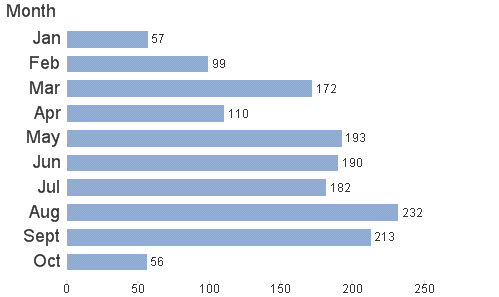
I'm trying to return the dimension value that AGGR() has created and aggregated over. I've used the following formula in an expression, with Month as my dimension in my chart, to find the max values every month:
=MAX(AGGR(SUM({<[Not_My_Dummy] = {'0'} , My_dummy = {'1'}, ResolutionDate -= {'Null'}>} ABC_Resolved_Dummy), ResolvedBy, Month))

However, I would like to return the Dimension Values that correspond to these numbers, is this possible? For example, in August, the Max count is 232, corresponding to John Doe. I wish to represent John Doe on this chart for August so it's easy to I.D. who is performing well...
344 Views
0 Replies