Unlock a world of possibilities! Login now and discover the exclusive benefits awaiting you.
- Qlik Community
- :
- All Forums
- :
- QlikView App Dev
- :
- Re: Rolling Average Issue
- Subscribe to RSS Feed
- Mark Topic as New
- Mark Topic as Read
- Float this Topic for Current User
- Bookmark
- Subscribe
- Mute
- Printer Friendly Page
- Mark as New
- Bookmark
- Subscribe
- Mute
- Subscribe to RSS Feed
- Permalink
- Report Inappropriate Content
Rolling Average Issue
Hi Everyone,
Need advise with Rolling Monthly Average. Please see below how I tried but failed.
- Mark as New
- Bookmark
- Subscribe
- Mute
- Subscribe to RSS Feed
- Permalink
- Report Inappropriate Content
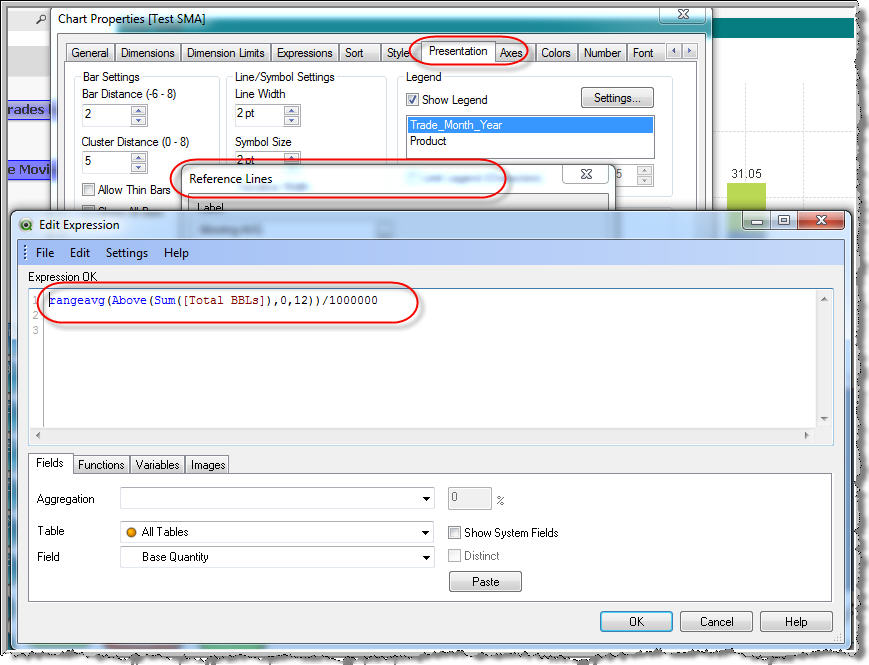
As far as I know, reference lines are straight lines and cannot move up or down. Why don't you use a combo chart and add another expression (RangeAvg(Above(Sum([Total BBLs]), 0, 12))/1000000) for your reference line.
- Mark as New
- Bookmark
- Subscribe
- Mute
- Subscribe to RSS Feed
- Permalink
- Report Inappropriate Content
The problem is the Dimension has Product(which is broken down into several sub-products). See below
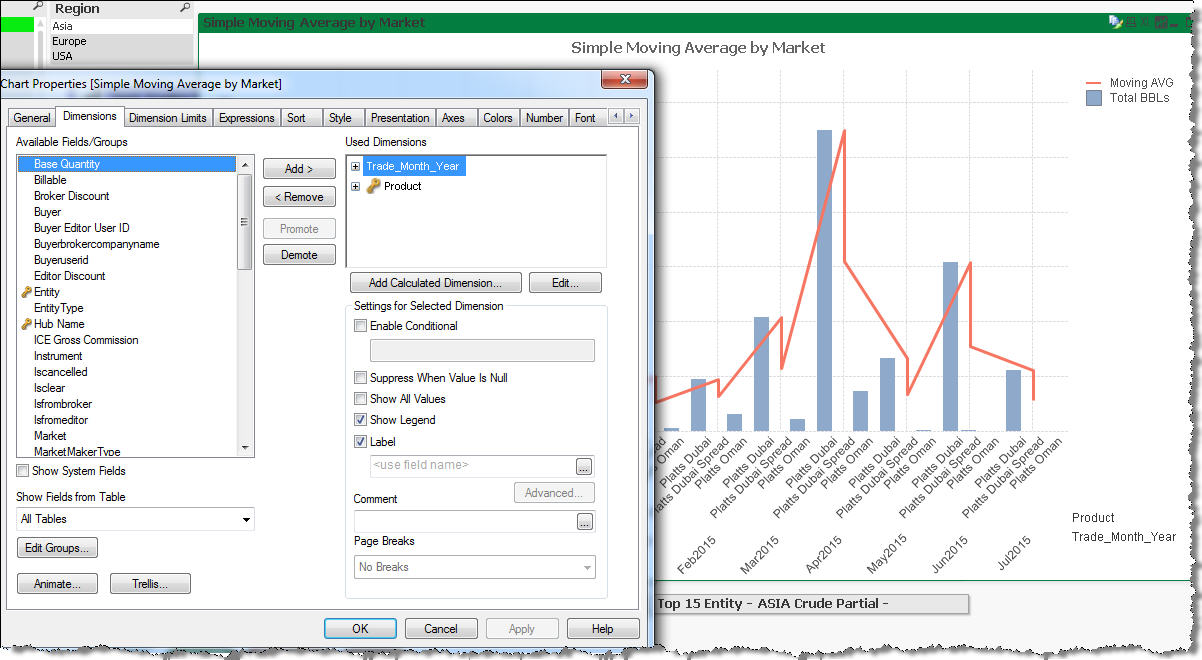
I don't want the Average for each Sub-products, but the moving average of the main products, and the same time displaying the sub-products in each bar.
- Mark as New
- Bookmark
- Subscribe
- Mute
- Subscribe to RSS Feed
- Permalink
- Report Inappropriate Content
Maybe use TOTAL in your expression:
RangeAvg(Above(Sum(TOTAL <Sub-Poducts> [Total BBLs]), 0, 12))/1000000
- Mark as New
- Bookmark
- Subscribe
- Mute
- Subscribe to RSS Feed
- Permalink
- Report Inappropriate Content
Hmm, doesn't work.
- Mark as New
- Bookmark
- Subscribe
- Mute
- Subscribe to RSS Feed
- Permalink
- Report Inappropriate Content
Not sure if this will work or not, but can you try this as well?
RangeAvg(Above(Sum(TOTAL <Product> [Total BBLs]), 0, 12))/1000000
- Mark as New
- Bookmark
- Subscribe
- Mute
- Subscribe to RSS Feed
- Permalink
- Report Inappropriate Content
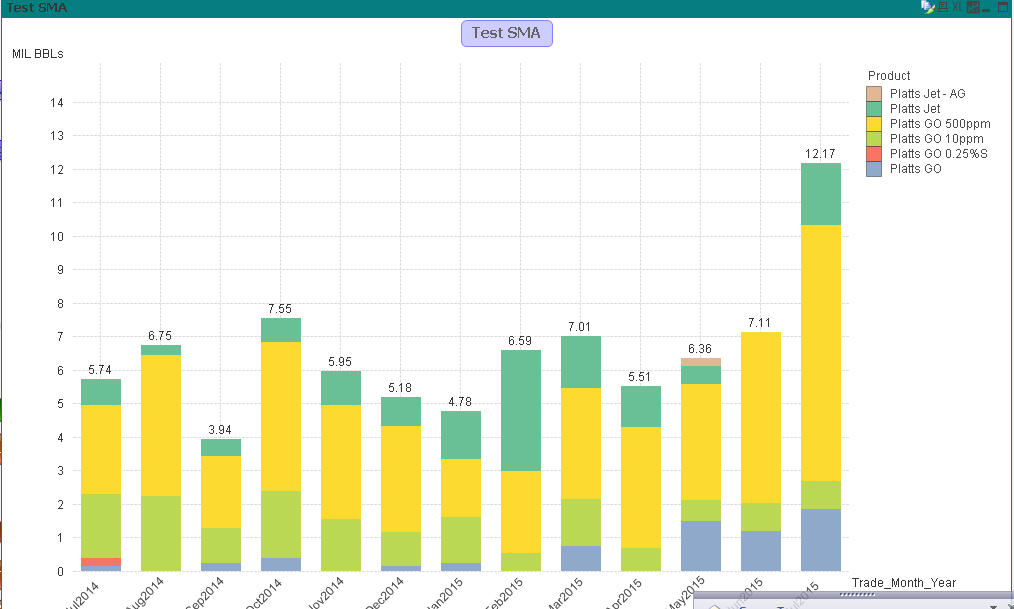
See below, I am trying to put a Rolling Average for the below chart