Unlock a world of possibilities! Login now and discover the exclusive benefits awaiting you.
- Qlik Community
- :
- All Forums
- :
- QlikView App Dev
- :
- Re: Rolling average line chart
- Subscribe to RSS Feed
- Mark Topic as New
- Mark Topic as Read
- Float this Topic for Current User
- Bookmark
- Subscribe
- Mute
- Printer Friendly Page
- Mark as New
- Bookmark
- Subscribe
- Mute
- Subscribe to RSS Feed
- Permalink
- Report Inappropriate Content
Rolling average line chart
Hi All,
Stuck with a new situation!! Please help.
I am trying to create a line chart which will have rolling average of targets. eg Month 1 = Targets%/1, Month 2 = Targets% (2 months total)/2, and so on.
Can some one tell me how and what will be the best way to do it.
My sample data is attached.
Dimensions are Month and Division, and expression is the rolling average.
Many thanks for your help!!
- Mark as New
- Bookmark
- Subscribe
- Mute
- Subscribe to RSS Feed
- Permalink
- Report Inappropriate Content
maybe...
- Mark as New
- Bookmark
- Subscribe
- Mute
- Subscribe to RSS Feed
- Permalink
- Report Inappropriate Content
dimension: Month and Division
expression1: sum(%target)/sum(Division)
expression2: sum(%target)
- Mark as New
- Bookmark
- Subscribe
- Mute
- Subscribe to RSS Feed
- Permalink
- Report Inappropriate Content
Hi Rodrigo,
Thanks for your reply.
But this is what I want to achieve.
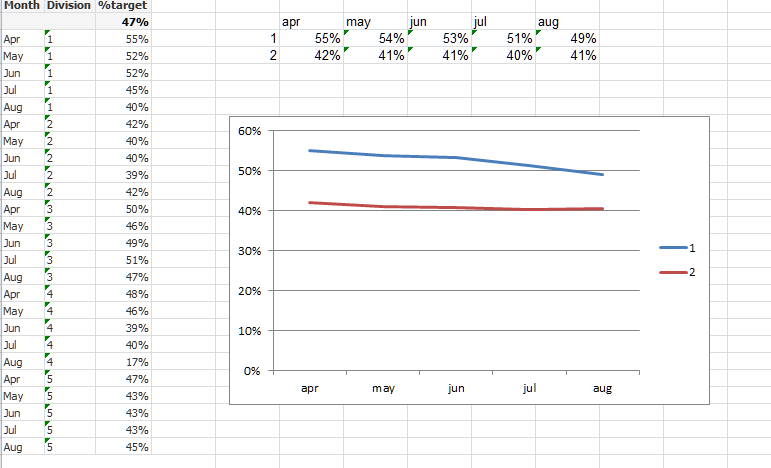
I want a line chart where the value for Aug will be sum( months apr to aug)/num of months
- Mark as New
- Bookmark
- Subscribe
- Mute
- Subscribe to RSS Feed
- Permalink
- Report Inappropriate Content
sum( %target)/count(Month)
- Mark as New
- Bookmark
- Subscribe
- Mute
- Subscribe to RSS Feed
- Permalink
- Report Inappropriate Content
Dimension:
month
Expressions:
Rangesum(above(aggr(sum({<Division={'1'}>}%target),Month,Division),0,RowNo()))/RowNo()
Rangesum(above(aggr(sum({<Division={'2'}>}%target),Month,Division),0,RowNo()))/RowNo()
Edit: Sortorder for month --->check LoadOrder-->original
hope this helps
