Unlock a world of possibilities! Login now and discover the exclusive benefits awaiting you.
- Qlik Community
- :
- All Forums
- :
- QlikView App Dev
- :
- Re: Rounding of percentage value
- Subscribe to RSS Feed
- Mark Topic as New
- Mark Topic as Read
- Float this Topic for Current User
- Bookmark
- Subscribe
- Mute
- Printer Friendly Page
- Mark as New
- Bookmark
- Subscribe
- Mute
- Subscribe to RSS Feed
- Permalink
- Report Inappropriate Content
Rounding of percentage value
Hi
I have a senario where i have to round the values
the data is as below
country value output
a 12.56 % 13 %
b 10.2 % 10 %
if the value after the point is >= 5 then it should make it as 13
if the value after the point is < 5 then it should make it as 10
Regards
- « Previous Replies
-
- 1
- 2
- Next Replies »
Accepted Solutions
- Mark as New
- Bookmark
- Subscribe
- Mute
- Subscribe to RSS Feed
- Permalink
- Report Inappropriate Content
You know what you could do is just forget the rounding function and use the integer format in the number tab. That will do the rounding AFTER the accumulation.
- Mark as New
- Bookmark
- Subscribe
- Mute
- Subscribe to RSS Feed
- Permalink
- Report Inappropriate Content
You can use Round function...
Dimension: Country
Expression: Round(value)
- Mark as New
- Bookmark
- Subscribe
- Mute
- Subscribe to RSS Feed
- Permalink
- Report Inappropriate Content
Hi tirumala i can use round but the my requirement is different,
if the value after point is >=5 then it should round to the next number
if it is less than 5 then it should round to the same number
- Mark as New
- Bookmark
- Subscribe
- Mute
- Subscribe to RSS Feed
- Permalink
- Report Inappropriate Content
Is that not what rounding does?
- Mark as New
- Bookmark
- Subscribe
- Mute
- Subscribe to RSS Feed
- Permalink
- Report Inappropriate Content
If(frac(value)>=0.5, Round(value), value) or if value is decimal just Round(value, 0.01).
- Mark as New
- Bookmark
- Subscribe
- Mute
- Subscribe to RSS Feed
- Permalink
- Report Inappropriate Content
Hi Aron
this is what i'm getting

can you please help me
- Mark as New
- Bookmark
- Subscribe
- Mute
- Subscribe to RSS Feed
- Permalink
- Report Inappropriate Content
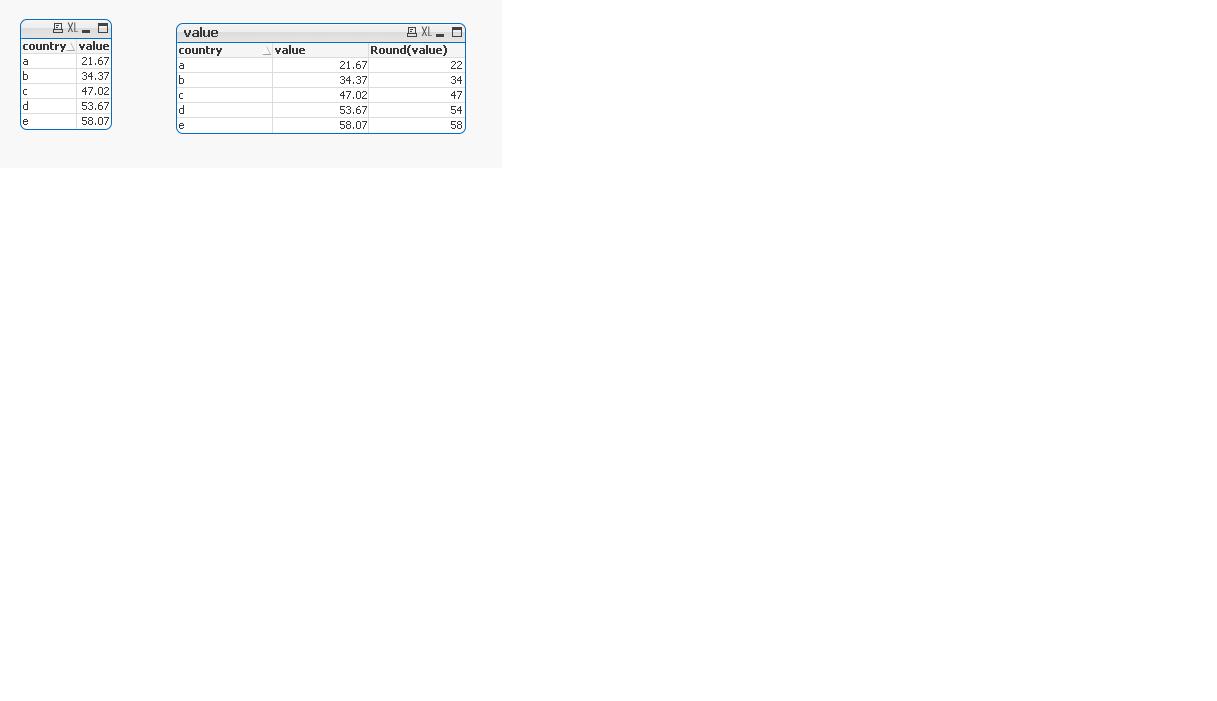
the first column is with out rounding and secondone is with rounding
- Mark as New
- Bookmark
- Subscribe
- Mute
- Subscribe to RSS Feed
- Permalink
- Report Inappropriate Content
something is going on in that chart that I am not privy to.
If you could create a sample version of this data and upload it here, maybe I can give you a better answer.
- Mark as New
- Bookmark
- Subscribe
- Mute
- Subscribe to RSS Feed
- Permalink
- Report Inappropriate Content
Round function works exactly as you described. I just took few values you provided and it is giving correct results. Please check your expressions or script to make sure you have the correct definition of the fields..
- Mark as New
- Bookmark
- Subscribe
- Mute
- Subscribe to RSS Feed
- Permalink
- Report Inappropriate Content
Hi Aron, i'm doing an accumilation to get these percentage values, will that effect the chart
i'm using the below expression to get the percentage values and acumilating it 10 steps backward
=round(sum({<IsSameMonth={'1'}>}TOT)/sum({<IsSameMonth={'1'}>}total(TOT)) * 100, 0.01)
- « Previous Replies
-
- 1
- 2
- Next Replies »