Unlock a world of possibilities! Login now and discover the exclusive benefits awaiting you.
- Qlik Community
- :
- All Forums
- :
- QlikView App Dev
- :
- Row wise calculation
- Subscribe to RSS Feed
- Mark Topic as New
- Mark Topic as Read
- Float this Topic for Current User
- Bookmark
- Subscribe
- Mute
- Printer Friendly Page
- Mark as New
- Bookmark
- Subscribe
- Mute
- Subscribe to RSS Feed
- Permalink
- Report Inappropriate Content
Row wise calculation
Hi all,
I want to calculate the average of data based on time range. Like suppose i have 3 values each for 3 days,then i want to calculate the average of values based on a particular day.
Data is already loaded in qlikview through excel.
Please help me with this.
Thanks
- Tags:
- new_to_qlikview
- « Previous Replies
-
- 1
- 2
- Next Replies »
- Mark as New
- Bookmark
- Subscribe
- Mute
- Subscribe to RSS Feed
- Permalink
- Report Inappropriate Content
Is this what you want?
PFA
- Mark as New
- Bookmark
- Subscribe
- Mute
- Subscribe to RSS Feed
- Permalink
- Report Inappropriate Content
hi tresesco
There is no attachment 
- Mark as New
- Bookmark
- Subscribe
- Mute
- Subscribe to RSS Feed
- Permalink
- Report Inappropriate Content
It is there.

Still one more i am oploading, if it comes visible to you.
- Mark as New
- Bookmark
- Subscribe
- Mute
- Subscribe to RSS Feed
- Permalink
- Report Inappropriate Content
No attachment. Can you please send it again?

- Mark as New
- Bookmark
- Subscribe
- Mute
- Subscribe to RSS Feed
- Permalink
- Report Inappropriate Content
Load this data,
Load * inline [
Date, Sales
06-09-2013, 100
06-09-2013, 200
06-09-2013, 300
06-09-2013, 400
07-09-2013, 300
07-09-2013, 400
07-09-2013, 500
];
Then Create a Straight table with Date as dimension, expression Avg(Sales). Check the result and let know.
- Mark as New
- Bookmark
- Subscribe
- Mute
- Subscribe to RSS Feed
- Permalink
- Report Inappropriate Content
considering your example, I have already loaded both fields Date and Sales.
Now I want to avg out the values based on dates and which should be independent of selection.
So if I am using chart, how I am supposed to write expression ?
ex.select avg(Sales) from ..... where date="06-09-2013 something similar to this.
- Mark as New
- Bookmark
- Subscribe
- Mute
- Subscribe to RSS Feed
- Permalink
- Report Inappropriate Content
This?
Avg ({<Date={'06-09-2013'}>} Sales)
- Mark as New
- Bookmark
- Subscribe
- Mute
- Subscribe to RSS Feed
- Permalink
- Report Inappropriate Content
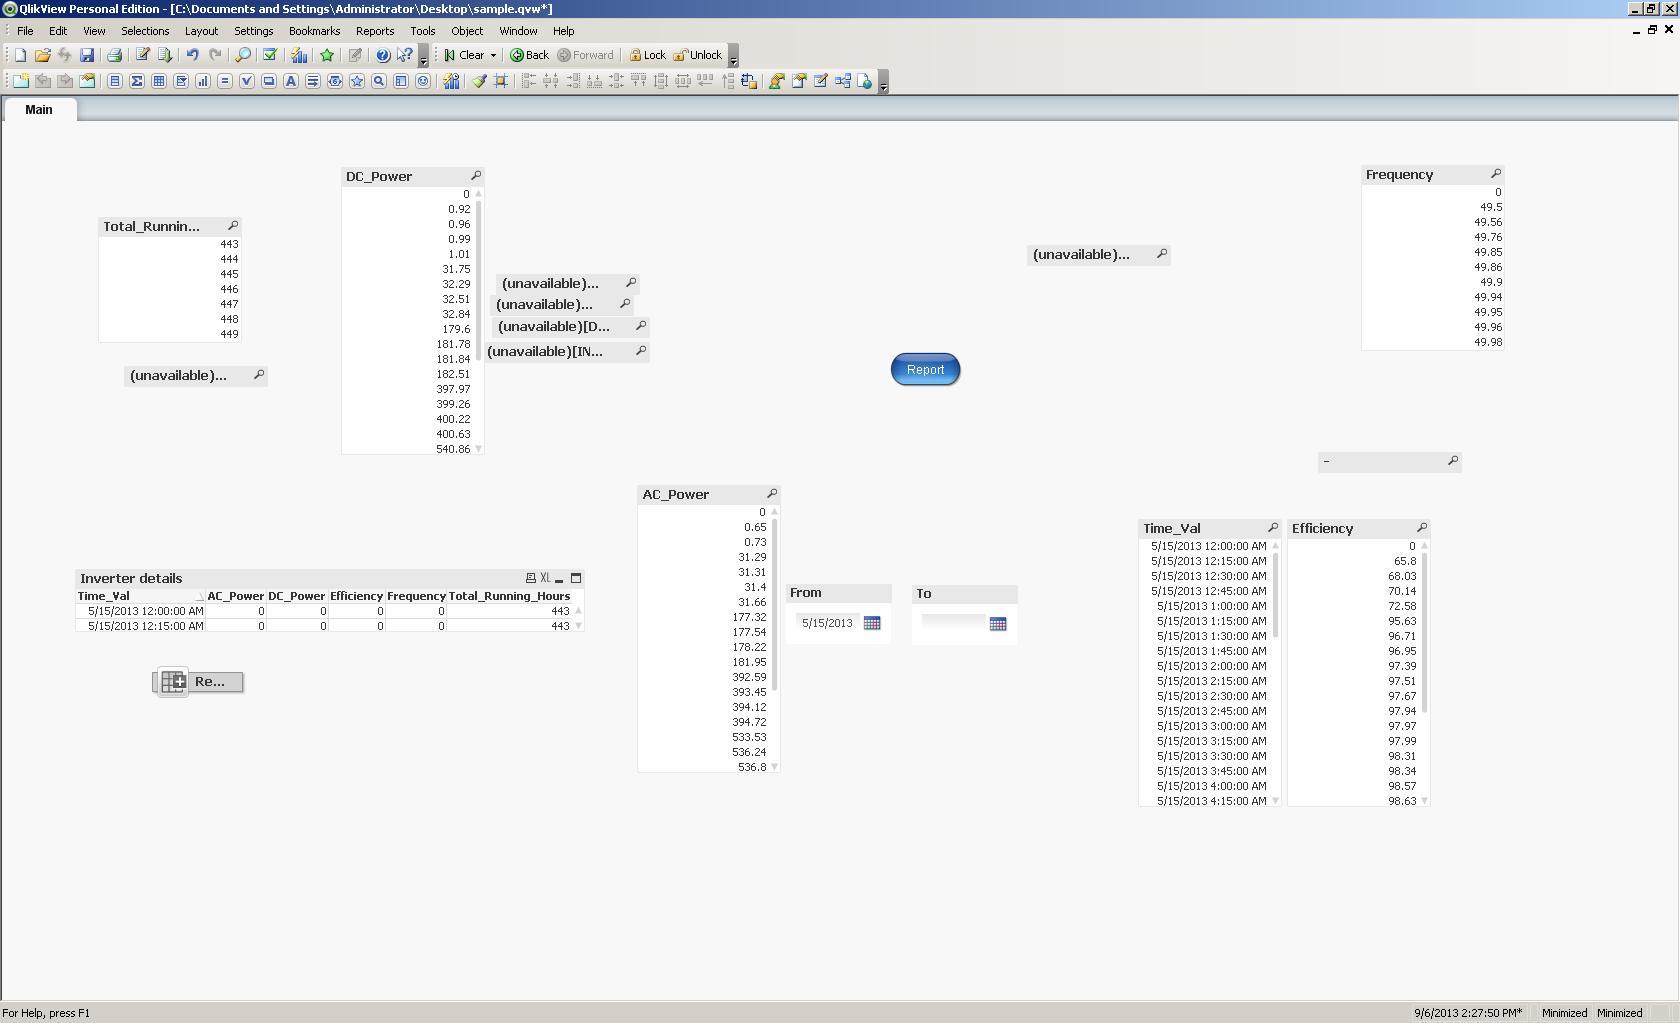
PFA.
In this I have already loaded fileds 'Time_Val' & 'Efficiency' from my database.
Now I want another listbox which will have average values of efficiency based on date.
- Mark as New
- Bookmark
- Subscribe
- Mute
- Subscribe to RSS Feed
- Permalink
- Report Inappropriate Content
In the script something like:
Load Avg(Efficiency) as AvgEff
From <> Group By Date;
Or list box expression:
Aggr(Avg(Efficiency), Date)
- « Previous Replies
-
- 1
- 2
- Next Replies »