Unlock a world of possibilities! Login now and discover the exclusive benefits awaiting you.
- Qlik Community
- :
- All Forums
- :
- QlikView App Dev
- :
- Running Total in Qlikview
- Subscribe to RSS Feed
- Mark Topic as New
- Mark Topic as Read
- Float this Topic for Current User
- Bookmark
- Subscribe
- Mute
- Printer Friendly Page
- Mark as New
- Bookmark
- Subscribe
- Mute
- Subscribe to RSS Feed
- Permalink
- Report Inappropriate Content
Running Total in Qlikview
My table has the stock movement for each item by day. So at any point if I want to find the current stock, I need to sum all the stock movements from the day business started.
Now I want to create a report which shows the stock level over a period of time. The period can be selected by the user.
Here is a simplified version of my table:
Stock:
LOAD * INLINE
[Brand,Item,Reason,Date,StockMovement
EveLom,E001,OpeningStock,01/01/2014,200
EveLom,E001,Sale,05/01/2014,-100
EveLom,E001,Purchase,01/03/2014,100
EveLom,E001,Sale,01/05/2014,-50
EveLom,E001,Sale,01/10/2014,-50
EveLom,E001,Sale,21/10/2014,-20
EveLom,E001,Sale,01/01/2015,-30
EveLom,E001,Sale,01/03/2015,-10
EveLom,E001,Purchase,01/04/2014,100
EveLom,E002,OpeningStock,01/01/2014,2000
EveLom,E002,Sale,05/01/2014,-100
EveLom,E002,Purchase,01/03/2014,100
EveLom,E002,Sale,01/05/2014,-50
EveLom,E002,Sale,01/10/2014,-50
EveLom,E002,Sale,01/11/2014,-20
EveLom,E002,Sale,01/01/2015,-30
EveLom,E002,Sale,01/02/2015,-10
EveLom,E002,Purchase,01/03/2014,100
LQ,L001,OpeningStock,01/01/2014,1000
LQ,L001,Sale,05/01/2014,-100
LQ,L001,Purchase,01/03/2014,100
LQ,L001,Sale,01/05/2014,-50
LQ,L001,Sale,01/10/2014,-50
LQ,L001,Sale,21/10/2014,-20
LQ,L001,Sale,01/01/2015,-30
LQ,L001,Sale,01/03/2015,-10
LQ,L001,Purchase,01/04/2014,100
LQ,L002,OpeningStock,01/01/2014,5000
LQ,L002,Sale,05/01/2014,-100
LQ,L002,Purchase,01/03/2014,100
LQ,L002,Sale,01/05/2014,-500
LQ,L002,Sale,01/10/2014,-500
LQ,L002,Sale,01/11/2014,-200
LQ,L002,Sale,01/01/2015,-300
LQ,L002,Sale,01/02/2015,-100
LQ,L002,Purchase,01/03/2014,100
];
There four items and they are grouped under 2 brands.
Now I want a stacked bar chart for Stock Level by Brand Vs Month.
The chart should look like below. (I created this one for sales.)
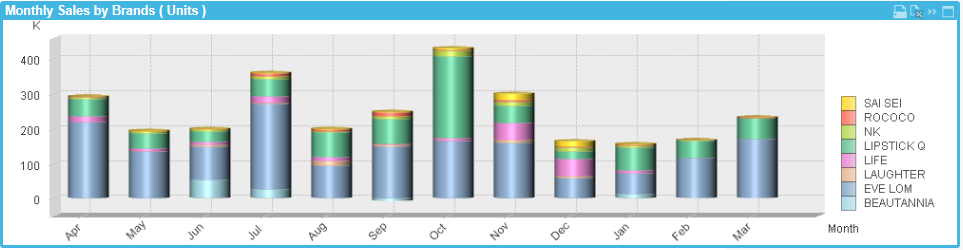
Months will be in X-Axis.
Stock will be in Y-Axis.
I have attached a qvw document with the sample data and calendar.
I tried several methods without any success. Any ideas/guidance will be much appreciated.
- « Previous Replies
-
- 1
- 2
- Next Replies »
- Mark as New
- Bookmark
- Subscribe
- Mute
- Subscribe to RSS Feed
- Permalink
- Report Inappropriate Content
This prints correct values but when I select Year 2015, it still shows the values for 2014 as well.
When Year 2015 is selected, only months from 2015 should be shown.
- Mark as New
- Bookmark
- Subscribe
- Mute
- Subscribe to RSS Feed
- Permalink
- Report Inappropriate Content
I am not sure on how to do that without modifying the backend script, I would suggest using Ruben solution instead
- Mark as New
- Bookmark
- Subscribe
- Mute
- Subscribe to RSS Feed
- Permalink
- Report Inappropriate Content
Thanks. This is the best solution I have come across. I marked yours as the correct answer.
- « Previous Replies
-
- 1
- 2
- Next Replies »