Unlock a world of possibilities! Login now and discover the exclusive benefits awaiting you.
- Qlik Community
- :
- All Forums
- :
- QlikView App Dev
- :
- Re: Running average of previous 3 months
- Subscribe to RSS Feed
- Mark Topic as New
- Mark Topic as Read
- Float this Topic for Current User
- Bookmark
- Subscribe
- Mute
- Printer Friendly Page
- Mark as New
- Bookmark
- Subscribe
- Mute
- Subscribe to RSS Feed
- Permalink
- Report Inappropriate Content
Running average of previous 3 months
Dear all, need a bit of help on this one...
I have 2 columns Month & sales.
Required a third column that has average of previous three months...
E.g.: today is 03-03-2015.
So, previous 3 months average would include average of current month March & previous 2 months that is Jan & Feb.
Also the constraint is that all the records must have the corresponding values and should change on selections.
For reference attaching excel that consists of two sheets.
One contains data & second sheet shows the required output.
Kindly guide on the same...
- Mark as New
- Bookmark
- Subscribe
- Mute
- Subscribe to RSS Feed
- Permalink
- Report Inappropriate Content
Perhaps this document helps: Calculating rolling n-period totals, averages or other aggregations
talk is cheap, supply exceeds demand
- Mark as New
- Bookmark
- Subscribe
- Mute
- Subscribe to RSS Feed
- Permalink
- Report Inappropriate Content
Is this what you require.????..Check out the sheet 1 of the application.
- Mark as New
- Bookmark
- Subscribe
- Mute
- Subscribe to RSS Feed
- Permalink
- Report Inappropriate Content
Hi Yuvraj,
In backend logic u need to do -->
Order by Year,Month
Read previous 3 record from current row logic.
Regards,
Mukesh Chaudhair
- Mark as New
- Bookmark
- Subscribe
- Mute
- Subscribe to RSS Feed
- Permalink
- Report Inappropriate Content
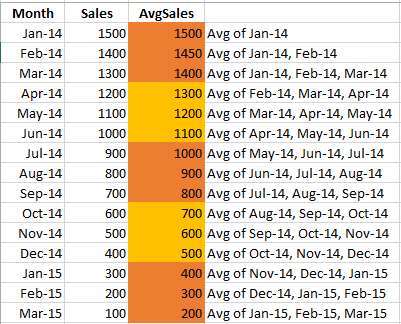
How can I also achieve the average of previous three months on selections....
Required output is as shown below...
Tried using: RangeSum(above(sum(Amount),0,3))/3
But the issue is on selection of a particular Month, it shows only one record, whereas the requirement is that on selection of a particular Month, it should show the averages of previous 3 Months from selected Month upto the start month in the Month field and not just the selected Month record.
Avail Fields: Month, Sales.
Required Output: AvgSales Field
- Mark as New
- Bookmark
- Subscribe
- Mute
- Subscribe to RSS Feed
- Permalink
- Report Inappropriate Content
Ok.. i'll try with the same...
- Mark as New
- Bookmark
- Subscribe
- Mute
- Subscribe to RSS Feed
- Permalink
- Report Inappropriate Content
Hi,
Try like this
Create a variable
vLast3MonthsAvgSales = Sum({<Year=, Month=, Date={'>=$(=MonthStart(Min(Date), -2))<=$(=Date(Min(Date)))'}>} Sales) / Count({<Year=, Month=, Date={'>=$(=MonthStart(Min(Date), -2))<=$(=Date(Min(Date)))'}>} DISTINCT Month)
Note : in the above expression replace Year=, Month=, Date= with your Year, Month and Date field names.
Now in chart use below expression
=If (RowNo() = 1, vLast3MonthsAvgSales, RangeSum(above(sum(Amount),0,3))/3)
Hope this helps you.
Regards,
Jagan.
- Mark as New
- Bookmark
- Subscribe
- Mute
- Subscribe to RSS Feed
- Permalink
- Report Inappropriate Content
Also we can approach
In the chart expression,
If(sales>1300,if(sales=1500,sales,RangeSum(Above(Sum(sales),0,2))/2),RangeSum(Above(Sum(sales),0,3))/3)