Unlock a world of possibilities! Login now and discover the exclusive benefits awaiting you.
- Qlik Community
- :
- All Forums
- :
- QlikView App Dev
- :
- SVG map chart issue.
- Subscribe to RSS Feed
- Mark Topic as New
- Mark Topic as Read
- Float this Topic for Current User
- Bookmark
- Subscribe
- Mute
- Printer Friendly Page
- Mark as New
- Bookmark
- Subscribe
- Mute
- Subscribe to RSS Feed
- Permalink
- Report Inappropriate Content
SVG map chart issue.
Hi,
Please check the .qvw file I attached and the problem that I face with it is that when I click on Year or Quarteror any other filters filters the states in the Map disappear. I just wanna display the number of subcribers for a particular filter value. Can someone please help me out!
- « Previous Replies
-
- 1
- 2
- Next Replies »
Accepted Solutions
- Mark as New
- Bookmark
- Subscribe
- Mute
- Subscribe to RSS Feed
- Permalink
- Report Inappropriate Content
I got the issue cleared. There was no problem with the map but the issue was with the expression. When I click some filter, the value of No.of.Subcribers becomes lesser than 145273 and that is why none of the states gets selected.
I solved the issue by using two variables.
by having Sum(No.of.Subscribers) as variable1
and Sum({<Month = ,[Customer Segmentation]=,Mobility=,Quarter=,State=,[Tariff Plan]=>} No.of.Subscribers) as variable2.
Then I changed the expression in svg map as =if($(Variable1)>=(0.9*$(Variable2)),'#0f3d0f',if((($(Variable1)<(0.9*$(Variable2))) And ($(Variable1)>=(0.7*$(Variable2)))),'#577757',if((($(Variable1)<(0.7*$(Variable2))) And ($(Variable1)>=(0.5*$(Variable2)))),'#9fb19f',if((($(Variable1)<(0.5*$(Variable2))) And ($(Variable1)>=(0.3*$(Variable2)))),'#ffb2b2',if((($(Variable1)<(0.3*$(Variable2))) And ($(Variable1)>=(0.1*$(Variable2)))),'#ff4c4c',if($(Variable1)<(0.1*$(Variable2)),'#ff0000'))))))
- Mark as New
- Bookmark
- Subscribe
- Mute
- Subscribe to RSS Feed
- Permalink
- Report Inappropriate Content
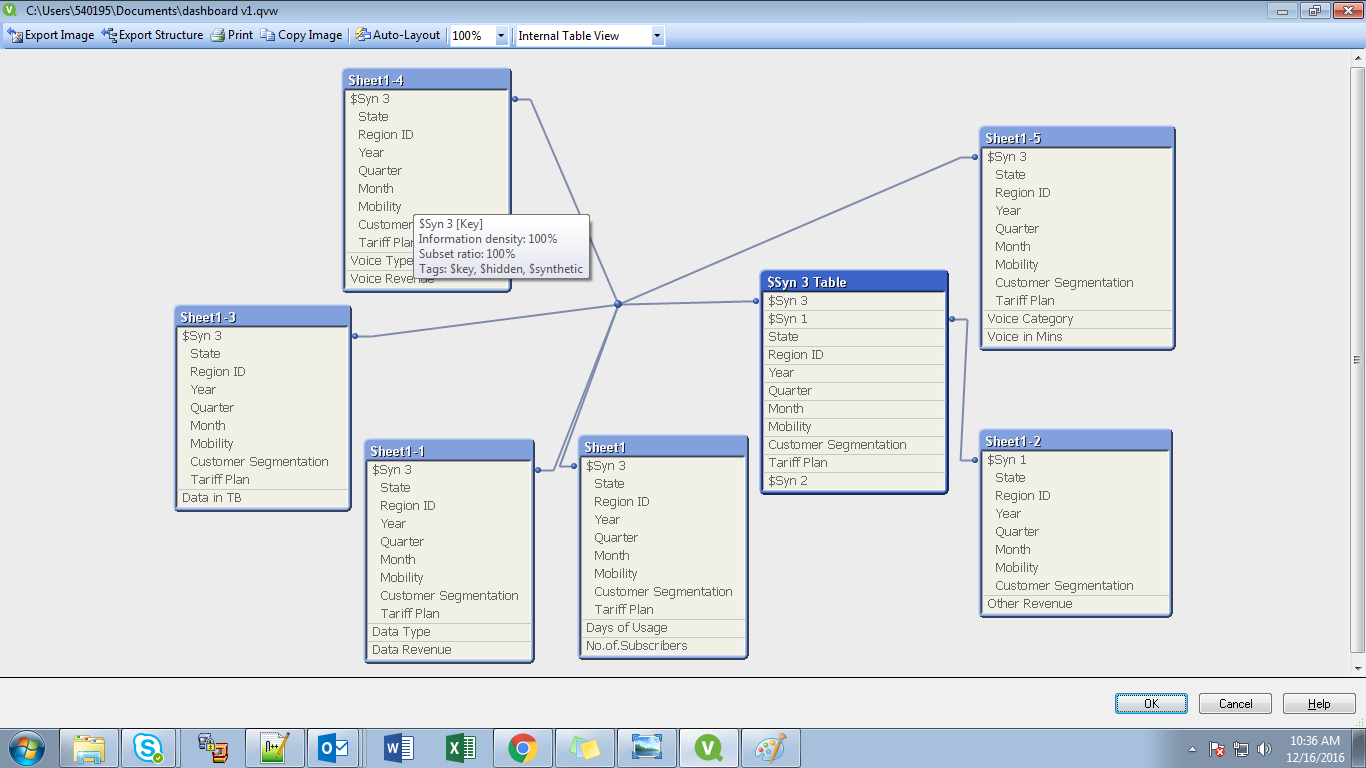
Your Data model has way too many Synthetic keys.
Clean up the data model or provide us with your data...?
State, Region, Year, Quarter, Month, Mobility and Customer Segmentation are repeating fields in all tables.
Every other thing looks fine. I've tested with my own SVG path.
You can probably use only 2 Tables? Use one Primary key.
- Mark as New
- Bookmark
- Subscribe
- Mute
- Subscribe to RSS Feed
- Permalink
- Report Inappropriate Content
These are the data that I use.
- Mark as New
- Bookmark
- Subscribe
- Mute
- Subscribe to RSS Feed
- Permalink
- Report Inappropriate Content
How is your color expression seems and Can you send Data model by using Ctrl + T and then share with us.
- Mark as New
- Bookmark
- Subscribe
- Mute
- Subscribe to RSS Feed
- Permalink
- Report Inappropriate Content
 Here is my data model.
- Mark as New
- Bookmark
- Subscribe
- Mute
- Subscribe to RSS Feed
- Permalink
- Report Inappropriate Content
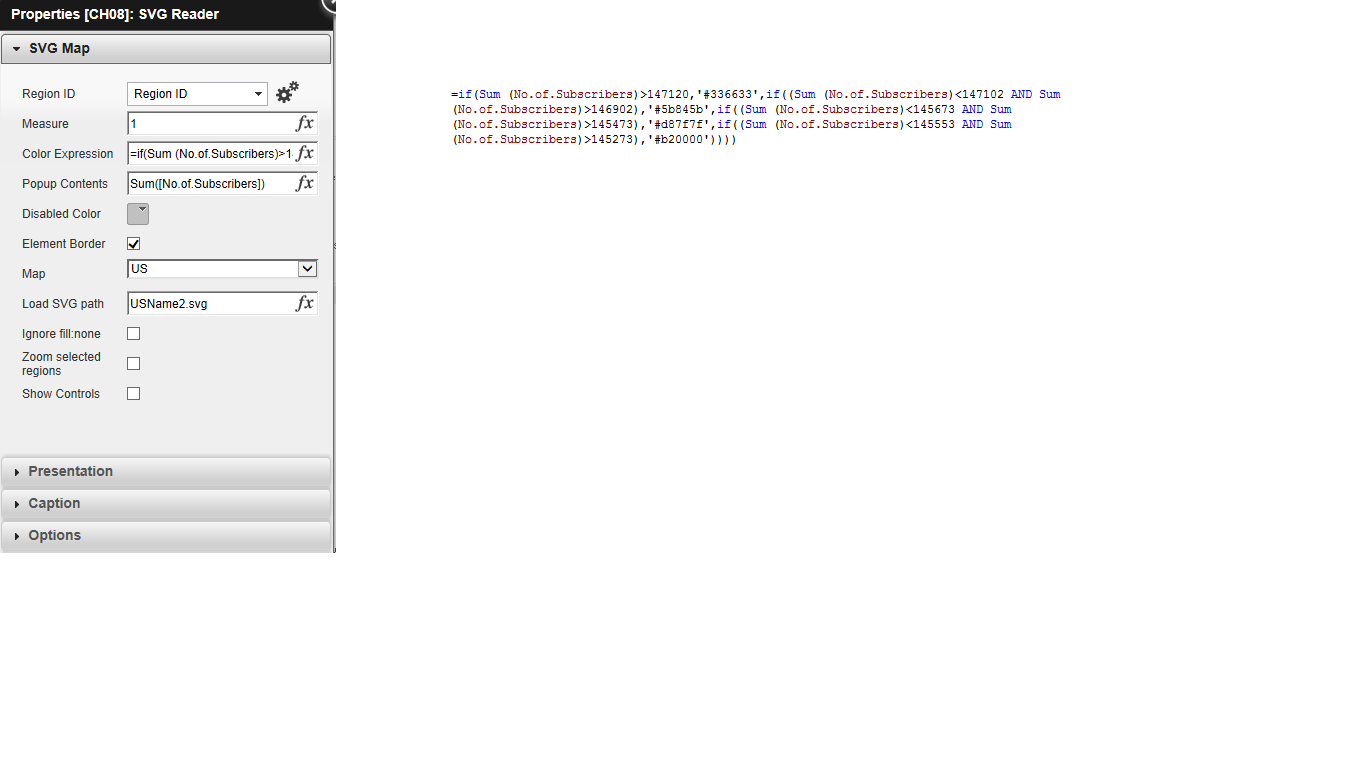
You have lot synthetic keys, That is not a problem to show SVG any how, Can you send Expression over there which you used to form the SVG? If so, might i have to llok. And then you have to send screen shot of Properies which is showing the tab for SVG Map
- Mark as New
- Bookmark
- Subscribe
- Mute
- Subscribe to RSS Feed
- Permalink
- Report Inappropriate Content

=if(Sum (No.of.Subscribers)>147120,'#336633',if((Sum (No.of.Subscribers)<147102 AND Sum (No.of.Subscribers)>146902),'#5b845b',if((Sum (No.of.Subscribers)<145673 AND Sum(No.of.Subscribers)>145473),'#d87f7f',if((Sum (No.of.Subscribers)<145553 AND Sum(No.of.Subscribers)>145273),'#b20000'))))
- Mark as New
- Bookmark
- Subscribe
- Mute
- Subscribe to RSS Feed
- Permalink
- Report Inappropriate Content
Try this expression
I hope Hex color codes are won't work. you may use this instead of that
=if(Sum(No.of.Subscribers)>147120,rgb(51,102,51),if((Sum (No.of.Subscribers)<147102 AND Sum (No.of.Subscribers)>146902),rgb(91,132,91),if((Sum (No.of.Subscribers)<145673 AND Sum(No.of.Subscribers)>145473),rgb(216,127,127),if((Sum (No.of.Subscribers)<145553 AND Sum(No.of.Subscribers)>145273),rgb(178,0,0)))))
And then use, Map as Plane which is default and then use Path like UsName2.states {Make sure, Qlikview is Case Sensitive - Be check whether Fields are correct or not and then check if there is any reaction or open anything then let us know}
- Mark as New
- Bookmark
- Subscribe
- Mute
- Subscribe to RSS Feed
- Permalink
- Report Inappropriate Content
There was no change after using that expression you gave me. Then I cant use this path UsName2.States because I dont have that chart in my svgmap folder, UsName2 is saved as a svg file in the svgmap folder. I dont understand "Map as Plane" what do you mean by that?
- Mark as New
- Bookmark
- Subscribe
- Mute
- Subscribe to RSS Feed
- Permalink
- Report Inappropriate Content
I am not sure, Where were you due to i don't have license
Try one more time with this, I just removed extra Parenthesis '(' for all if conditions and then i add nor white color
=if(Sum(No.of.Subscribers)>147120,rgb(51,102,51),
if(Sum (No.of.Subscribers)<147102 AND Sum (No.of.Subscribers)>146902),rgb(91,132,91),
if(Sum (No.of.Subscribers)<145673 AND Sum(No.of.Subscribers)>145473),rgb(216,127,127),
if((Sum (No.of.Subscribers)<145553 AND Sum(No.of.Subscribers)>145273),rgb(178,0,0), White()))))
And then use Select or Load a Map (This is for Plane which you are not understand)
- « Previous Replies
-
- 1
- 2
- Next Replies »