Unlock a world of possibilities! Login now and discover the exclusive benefits awaiting you.
- Qlik Community
- :
- All Forums
- :
- QlikView App Dev
- :
- Scatter Chart Dimension and Static Step
- Subscribe to RSS Feed
- Mark Topic as New
- Mark Topic as Read
- Float this Topic for Current User
- Bookmark
- Subscribe
- Mute
- Printer Friendly Page
- Mark as New
- Bookmark
- Subscribe
- Mute
- Subscribe to RSS Feed
- Permalink
- Report Inappropriate Content
Scatter Chart Dimension and Static Step
Dear Friends,
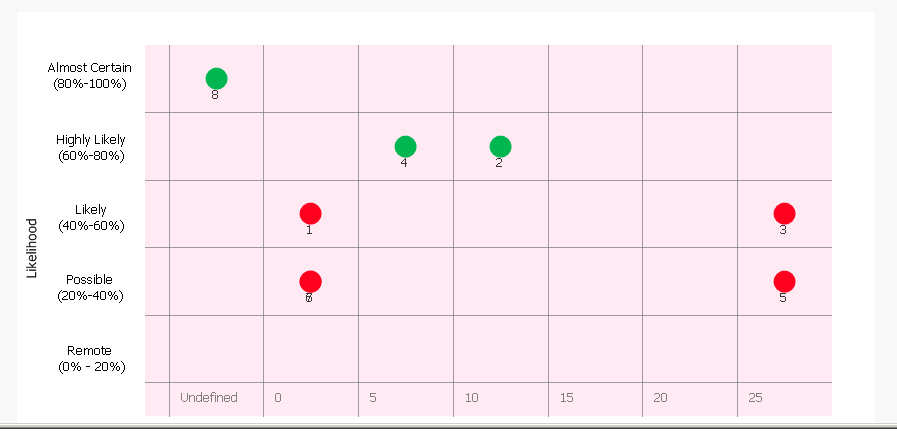
I am creating a scatter chart and need your help. Please find attached Qvw. (Ref : Attached Image)
On my X axis I have my Value (EBITDA Max field) (Numeric)
on Y axis I have my Relative value (% Like) (Numeric)
Bubble is with respect to SrNo (Numeric)
I want to restrict the X axis to plot only values from 0 to all the positive values. Also the negative values should plot 'UnQualified' before the zero.
All the positive values should fit in 5 grid lines only where my static min should be from Zero and static max should be the max of the EBITDA field. The static step should be divided in 5 equal parts on the X axis and 'UnQualified' should be the sixth one before the zero. Resulting six equal grid on the X axis to be created dynamically.
Kindly let me know if there is a way out for this.
Thank you in Advance !!
![]()
- « Previous Replies
-
- 1
- 2
- Next Replies »
- Mark as New
- Bookmark
- Subscribe
- Mute
- Subscribe to RSS Feed
- Permalink
- Report Inappropriate Content
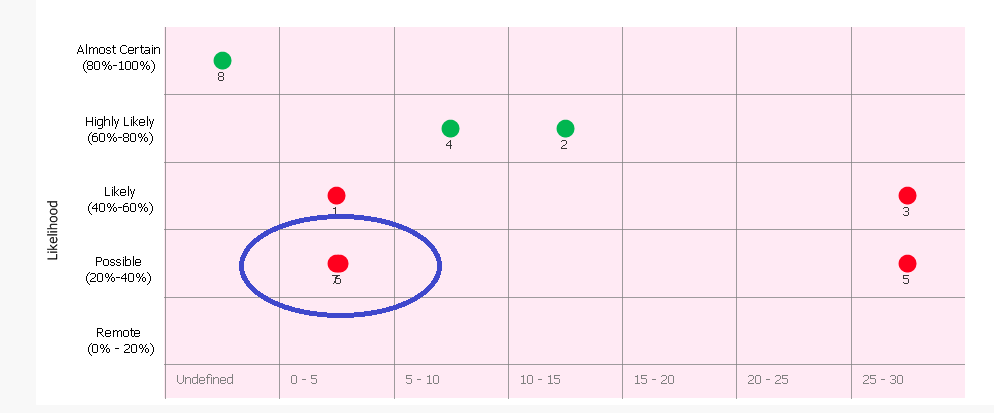
Here is the extra '5th' line added (it was missing).
FYI It currently buckets 'upwards' . So a 0 value will show in 0-5 (actually 0-4) and a value of 5 will show in 5-9.

- Mark as New
- Bookmark
- Subscribe
- Mute
- Subscribe to RSS Feed
- Permalink
- Report Inappropriate Content
Thank You Jonathan !! ![]()
I want to understand - Is there a way to separate the bubble with Sr 6 and 7 which are overlapping.
Because they both have different values. I understanding this is happening as we are aggregating the values in the expression to fit in the grid made using the ref lines.
Is there a way out to separate these two ?
- Mark as New
- Bookmark
- Subscribe
- Mute
- Subscribe to RSS Feed
- Permalink
- Report Inappropriate Content
I don't see an easy way to do this but it may still be possible.
The label engine can't do this, so we basically need to change the chart expression to be 'unbucketted' and continuous and take advantage of the fact that there is a gap between 0 and .11 (value 6 and 7 ) even if the overall range is greater than 30 and that small difference of .11 will barely be apart and will also require you to stretch out the x axis horizontally across the screen to use as much real estated as possible
See effects below.
After doing this, i realized i would need to change the grid lines , min , max etc... or else values in the upper range of a bucket (like 2.5-5) will move over the border because the buckets forced all values to the minimum of the range and the grid lines are actually 1/2 way to the next bucket to get the right effect of a centered value ... and so going back to a 'continuous' range would require me to shift the grid lines to their true location... but most values would fall right on the border because of the buckets forcing additional changes.
All this to say, if you think the partial solution attached with partial overlap works then to implement this we would have to tweak all ~12 expressions used to build the chart with the main visual impact being that overlapping points are not as overlapping and values that fall on the border will appear on a border.
If values were the same 0 and 0 , then there would still be complete overlap, unless i could figure out a way to delimit the values on one bucket which i haven't been able to do so far. That would be better ideally too.
1000 pixels wide:

~1500 pixels wide:

- Mark as New
- Bookmark
- Subscribe
- Mute
- Subscribe to RSS Feed
- Permalink
- Report Inappropriate Content
Jonathan,
This is superb... I see there will be a challenge to split the bubbles with the same values but with different data points closer to each other... Your solution works great.
In case if you able to get the solution for overlapping values please let me know.
Thanks a lot !! ![]()
- Mark as New
- Bookmark
- Subscribe
- Mute
- Subscribe to RSS Feed
- Permalink
- Report Inappropriate Content
Ok great. I'll have to update the doc.. since as you may have noticed with this new setting 0 and 0.11 will show up roughly in the middle of the range but anything over 2.5 will now spill over the x axis=5 grid line into the next block which is not what we want.
should take me about 10 mins ... when i have 10 mins ![]() stay tuned.
stay tuned.
- Mark as New
- Bookmark
- Subscribe
- Mute
- Subscribe to RSS Feed
- Permalink
- Report Inappropriate Content
Here is the full changes

- Mark as New
- Bookmark
- Subscribe
- Mute
- Subscribe to RSS Feed
- Permalink
- Report Inappropriate Content
Genius !! ![]()
- « Previous Replies
-
- 1
- 2
- Next Replies »