Unlock a world of possibilities! Login now and discover the exclusive benefits awaiting you.
- Qlik Community
- :
- All Forums
- :
- QlikView App Dev
- :
- Re: Scatter Chart with Date value in X-Axis
- Subscribe to RSS Feed
- Mark Topic as New
- Mark Topic as Read
- Float this Topic for Current User
- Bookmark
- Subscribe
- Mute
- Printer Friendly Page
- Mark as New
- Bookmark
- Subscribe
- Mute
- Subscribe to RSS Feed
- Permalink
- Report Inappropriate Content
Scatter Chart with Date value in X-Axis
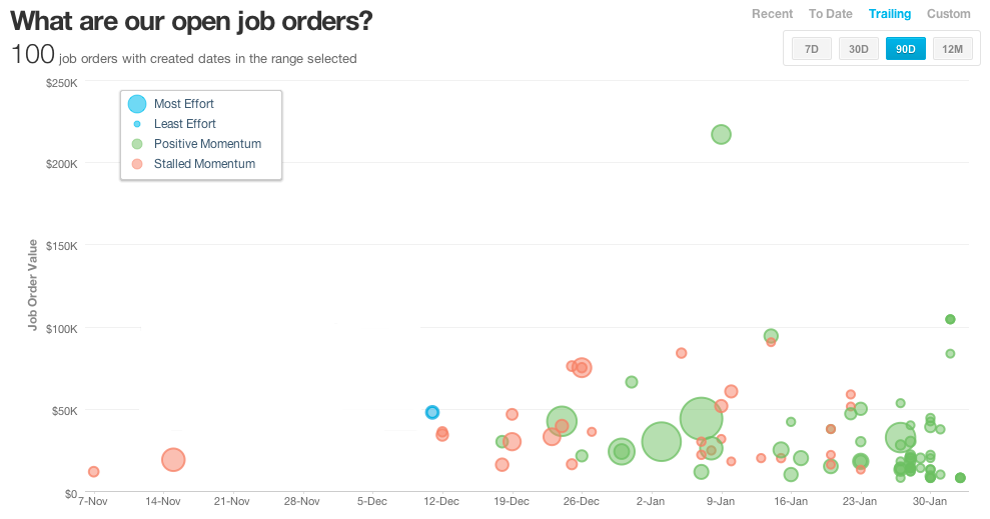
I am trying to build a scatter chart (bubble charts) where in dates values are in x-axis and sales values in y-axis. When I create in QV x-axis values shows only numbers. Can someone help me how can I show dates in x-axis? Attach a pic for reference.
- Mark as New
- Bookmark
- Subscribe
- Mute
- Subscribe to RSS Feed
- Permalink
- Report Inappropriate Content
For Scatter chart both x and y axis should be expressions, but date is a dimension.
Instead of using Scatter you can go for either Bar or Line chart..
- Mark as New
- Bookmark
- Subscribe
- Mute
- Subscribe to RSS Feed
- Permalink
- Report Inappropriate Content
Thanks for the reply...
I can create bar chart.. no issue.
But is there any way to create a chart as mentioned in the pic?
- Mark as New
- Bookmark
- Subscribe
- Mute
- Subscribe to RSS Feed
- Permalink
- Report Inappropriate Content
Hello..
I got the solution, we can create a combo chart wherein in the expression tab select Symbols (any symbol as per your choice) and it works perfect.
Thanks for all your support.
- Mark as New
- Bookmark
- Subscribe
- Mute
- Subscribe to RSS Feed
- Permalink
- Report Inappropriate Content
Hi,
Did you ever find a solution for this?
I too am looking for a way to have a date value on the x-axis....
- Mark as New
- Bookmark
- Subscribe
- Mute
- Subscribe to RSS Feed
- Permalink
- Report Inappropriate Content
not quite a new thread, but a solution might be:
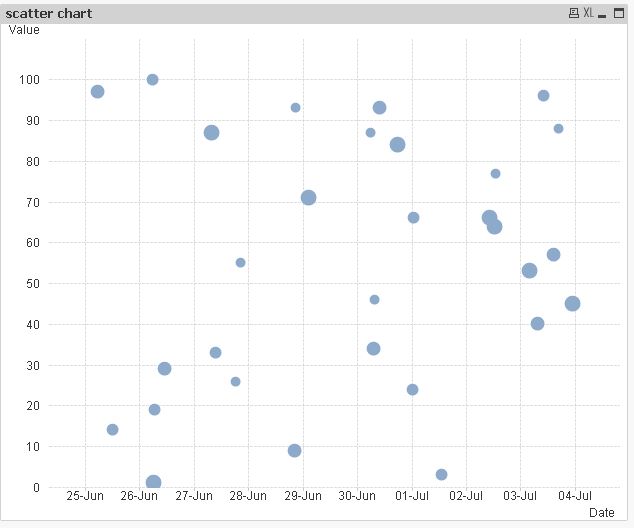
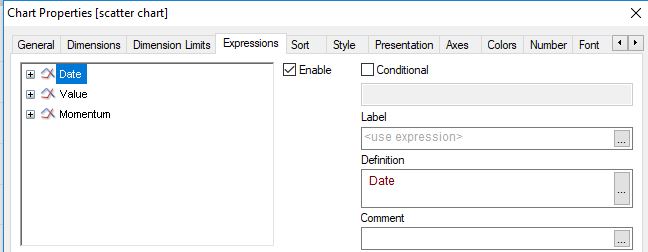

table1:
LOAD RecNo() as ID,
    Timestamp(Today()-Rand()*10) as Date,
    Ceil(Rand()*100) as Value,
    Ceil((Rand()+0.5)*100) as Momentum
AutoGenerate 30;
hope this helps
regards
Marco
- Mark as New
- Bookmark
- Subscribe
- Mute
- Subscribe to RSS Feed
- Permalink
- Report Inappropriate Content
Hi Marco,
This really looks like the solution I need - although I can't get it to fit my data. I've attached a sample app where I am trying to achieve this in a GridChart (which probably isn't the best solution). I need the month_year on the x-axis, the minimum cost on the y-axis and the size of the bubble on relating to the QTY purchased...
If you selected 'Gilmour D' as a salesperson, I would like to be able to see an equal spread on the y-axis :

where the values would start on £14 going up in .50 increments £14.00, £14.50, £15.00 upto £19.50....
Is this possible?
Thanks again for any help/advice.
Phil
- Mark as New
- Bookmark
- Subscribe
- Mute
- Subscribe to RSS Feed
- Permalink
- Report Inappropriate Content
please open a new thread for this grid chart question as this thread is related to scatter charts.
thanks
regards
Marco