Unlock a world of possibilities! Login now and discover the exclusive benefits awaiting you.
- Qlik Community
- :
- All Forums
- :
- QlikView App Dev
- :
- Scatter chart Quadrant Sum
Options
- Subscribe to RSS Feed
- Mark Topic as New
- Mark Topic as Read
- Float this Topic for Current User
- Bookmark
- Subscribe
- Mute
- Printer Friendly Page
Turn on suggestions
Auto-suggest helps you quickly narrow down your search results by suggesting possible matches as you type.
Showing results for
Specialist II
2013-08-06
06:25 AM
- Mark as New
- Bookmark
- Subscribe
- Mute
- Subscribe to RSS Feed
- Permalink
- Report Inappropriate Content
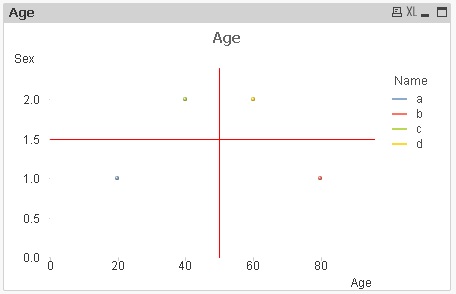
Scatter chart Quadrant Sum
I have a scatter chart with 4 quadrants and i need to show the sum (or average) of entries which falling in each quadrant.
is it possible? if yes how?
Thanks in advance
Image attached
1,188 Views
1 Solution
Accepted Solutions
Specialist II
2013-08-27
04:57 AM
Author
- Mark as New
- Bookmark
- Subscribe
- Mute
- Subscribe to RSS Feed
- Permalink
- Report Inappropriate Content
Not possible in qlikview
561 Views
3 Replies
Specialist II
2013-08-06
08:04 AM
Author
- Mark as New
- Bookmark
- Subscribe
- Mute
- Subscribe to RSS Feed
- Permalink
- Report Inappropriate Content
is it possible???????????????
Regards
561 Views
Specialist II
2013-08-27
04:57 AM
Author
- Mark as New
- Bookmark
- Subscribe
- Mute
- Subscribe to RSS Feed
- Permalink
- Report Inappropriate Content
Not possible in qlikview
562 Views
Partner - Creator
2014-02-13
01:17 AM
- Mark as New
- Bookmark
- Subscribe
- Mute
- Subscribe to RSS Feed
- Permalink
- Report Inappropriate Content
In a way it is possible. But what i would like to achieve (and how i got here) is to not show every single value on the dimension, but rather increments of the number like 100s or 1000s.
See example attached
561 Views