Unlock a world of possibilities! Login now and discover the exclusive benefits awaiting you.
- Qlik Community
- :
- All Forums
- :
- QlikView App Dev
- :
- Re: Script calculation, Charting rolling months, a...
- Subscribe to RSS Feed
- Mark Topic as New
- Mark Topic as Read
- Float this Topic for Current User
- Bookmark
- Subscribe
- Mute
- Printer Friendly Page
- Mark as New
- Bookmark
- Subscribe
- Mute
- Subscribe to RSS Feed
- Permalink
- Report Inappropriate Content
Script calculation, Charting rolling months, average calculation
Hello,
I have a need to create a bar chart which will display the past 12 months including the current month with some calculations.
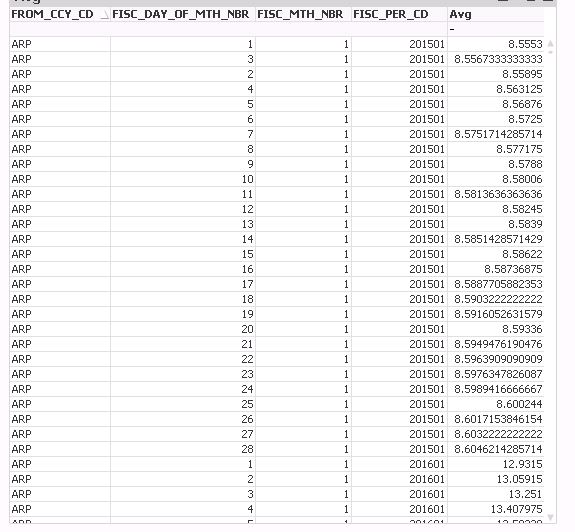
Rolling 12 months formula is available in plenty across the community, but my problem is calculating the average of a particular column from previous year. I have attached an excel which covers all the details, let me know if you need more information.
Thanks.
- Mark as New
- Bookmark
- Subscribe
- Mute
- Subscribe to RSS Feed
- Permalink
- Report Inappropriate Content
Is this a different question than what you have asked here: Rolling Sum/Rolling Average at Script
- Mark as New
- Bookmark
- Subscribe
- Mute
- Subscribe to RSS Feed
- Permalink
- Report Inappropriate Content
Yes this is the actual question, and the other question is a part of it. Please give me your suggestions on this.
- Mark as New
- Bookmark
- Subscribe
- Mute
- Subscribe to RSS Feed
- Permalink
- Report Inappropriate Content
Any suggestions?
- Mark as New
- Bookmark
- Subscribe
- Mute
- Subscribe to RSS Feed
- Permalink
- Report Inappropriate Content
Is there a way to pick only the last value of every month? Fisc_Day_Of_Mth_Nbr is the month days column for me.