Unlock a world of possibilities! Login now and discover the exclusive benefits awaiting you.
- Qlik Community
- :
- All Forums
- :
- QlikView App Dev
- :
- Re: Select 2 Values from a Field to see each one i...
Options
- Subscribe to RSS Feed
- Mark Topic as New
- Mark Topic as Read
- Float this Topic for Current User
- Bookmark
- Subscribe
- Mute
- Printer Friendly Page
Turn on suggestions
Auto-suggest helps you quickly narrow down your search results by suggesting possible matches as you type.
Showing results for
Creator III
2014-05-08
10:47 AM
- Mark as New
- Bookmark
- Subscribe
- Mute
- Subscribe to RSS Feed
- Permalink
- Report Inappropriate Content
Select 2 Values from a Field to see each one in a different Chart
Hello!
I have the following project where there is a table with periods and values for 3 IDs (1011, 1012 and 1013) like this:
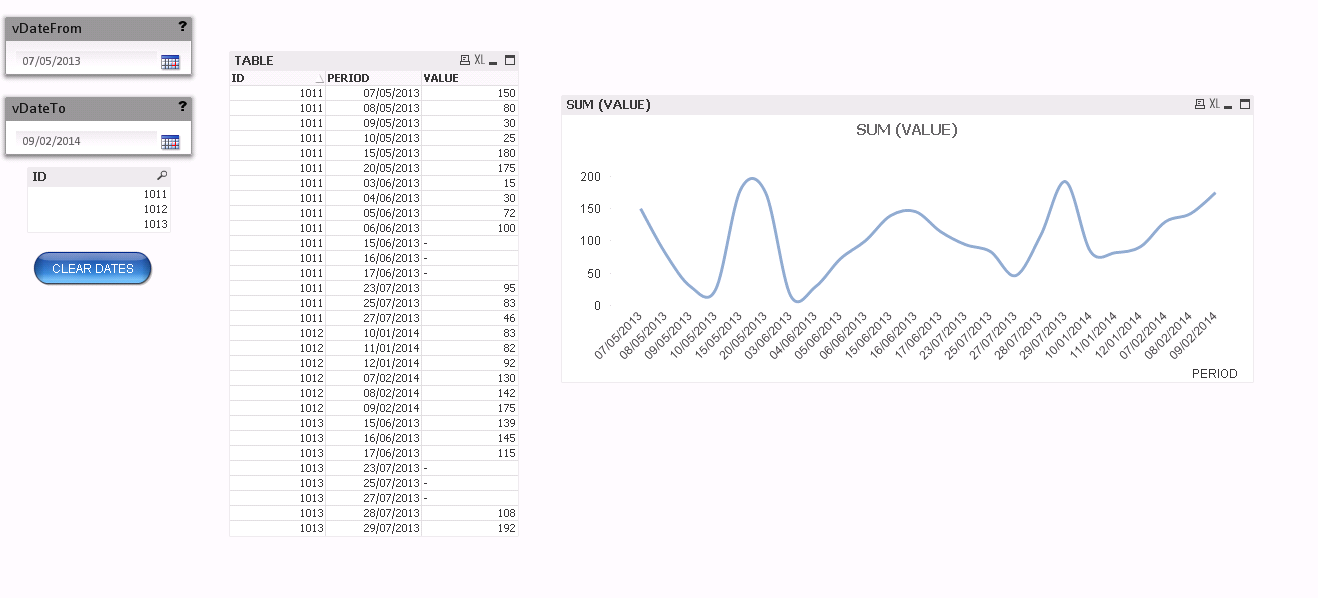
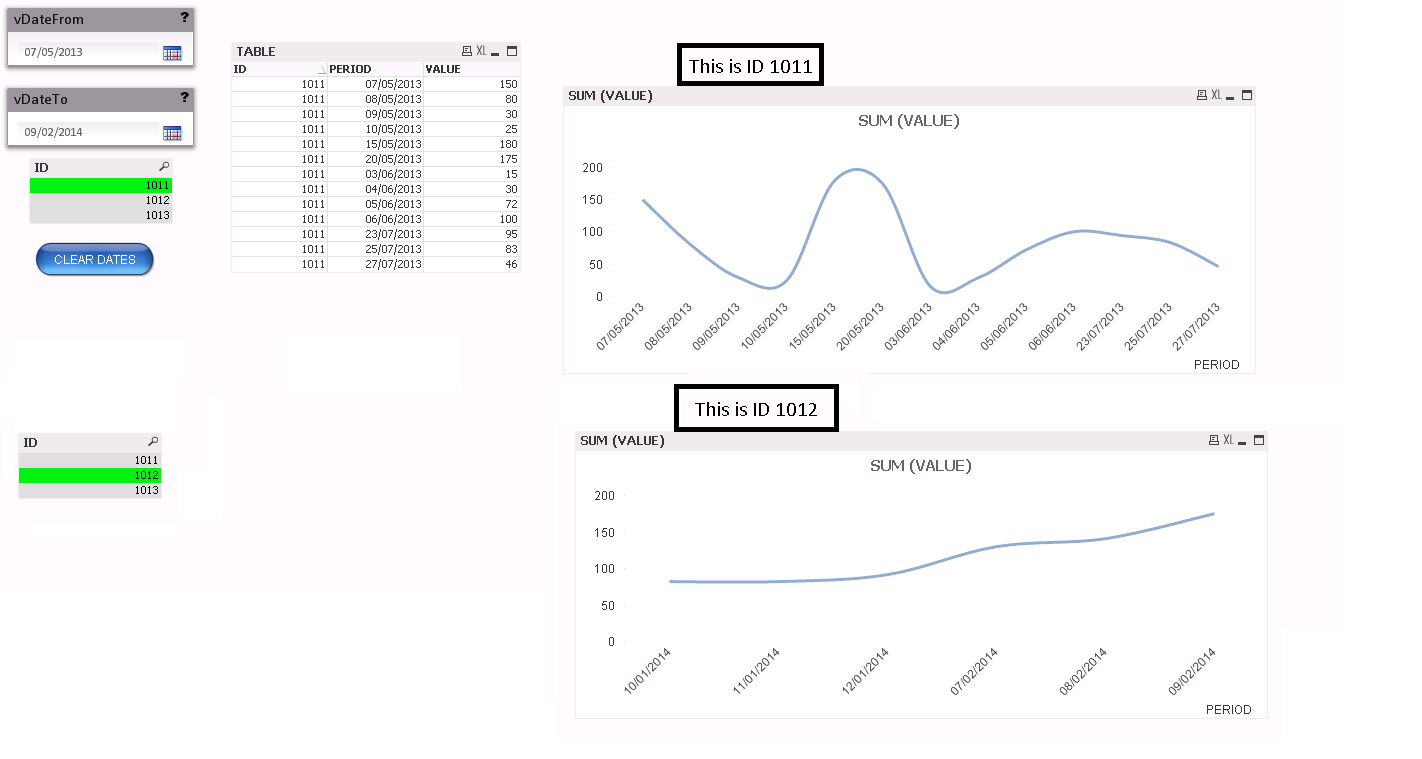
If I select a particular ID, I see the SUM (VALUE) for that ID. What I want is to create another chart to see other ID.
For example, I'd like to see ID 1011 in chart 1 and then select ID 1012 to see SUM for that ID.
Do you know if could that be possible?
I attach the QVW file.
Thank you!!!
- Tags:
- new_to_qlikview
240 Views
3 Replies
MVP
2014-05-08
10:50 AM
- Mark as New
- Bookmark
- Subscribe
- Mute
- Subscribe to RSS Feed
- Permalink
- Report Inappropriate Content
Have you tried Trellis option in your chart?
143 Views
Creator III
2014-05-08
10:53 AM
Author
- Mark as New
- Bookmark
- Subscribe
- Mute
- Subscribe to RSS Feed
- Permalink
- Report Inappropriate Content
Not yet. How could I apply it?
143 Views
MVP
2014-05-08
10:57 AM
- Mark as New
- Bookmark
- Subscribe
- Mute
- Subscribe to RSS Feed
- Permalink
- Report Inappropriate Content
AFAIR, it's on the bottom on dimension tab of your chart.
143 Views