Unlock a world of possibilities! Login now and discover the exclusive benefits awaiting you.
- Qlik Community
- :
- All Forums
- :
- QlikView App Dev
- :
- Re: Set Analysis - All but the max date.
- Subscribe to RSS Feed
- Mark Topic as New
- Mark Topic as Read
- Float this Topic for Current User
- Bookmark
- Subscribe
- Mute
- Printer Friendly Page
- Mark as New
- Bookmark
- Subscribe
- Mute
- Subscribe to RSS Feed
- Permalink
- Report Inappropriate Content
Set Analysis - All but the max date.
Hi Everyone,
I want to do analysis in charts using two expressions comparing the entire data set to the data set minus those where in the most recent entry date. I've come up with an overly complicated way and was wondering if there was a simple one.
Let me know if you have any ideas.
Thanks,
Rebecca
- Mark as New
- Bookmark
- Subscribe
- Mute
- Subscribe to RSS Feed
- Permalink
- Report Inappropriate Content
Can you share some sample data or apps?
- Mark as New
- Bookmark
- Subscribe
- Mute
- Subscribe to RSS Feed
- Permalink
- Report Inappropriate Content
The data I'm working with is quite large so it wouldn't be practical to attach it. But here I can show a mini example of what I want to do.
EntryDate | SalesA | SalesB |
| 1/1/2014 | 2 | 4 |
| 1/1/2014 | 10 | 5 |
| 2/1/2014 | 1 | 2 |
| 2/1/2014 | 2 | 3 |
| 2/1/2014 | 2 | 4 |
| 3/1/2014 | 1 | 2 |
| 3/1/2014 | 1 | 3 |
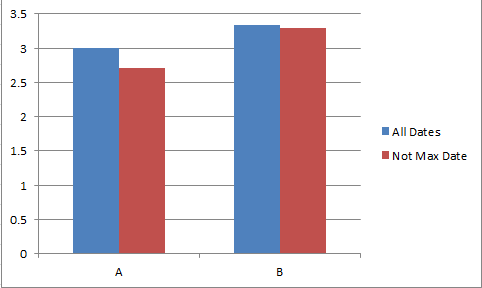
And this is what I want to create - where these are means of SalesA/SalesB.

- Mark as New
- Bookmark
- Subscribe
- Mute
- Subscribe to RSS Feed
- Permalink
- Report Inappropriate Content
How you got A and B here?
What is the Logic you have used to get above two bars?
- Mark as New
- Bookmark
- Subscribe
- Mute
- Subscribe to RSS Feed
- Permalink
- Report Inappropriate Content
The blue bar for A is the average of the entire column Sales A, while the red bar for A is the entire column minus the last two lines which have the max(EntryDate). Similarily, for B but with the SalesB column.
- Mark as New
- Bookmark
- Subscribe
- Mute
- Subscribe to RSS Feed
- Permalink
- Report Inappropriate Content
Hi Jaro,
Assuming Date and A/B are your chart dimensions, your expression for all dates would simply be sum(Sales). Your expression for all dates excluding the max date would look something like: =sum( {<Date = {"<$(vMaxDate)"}>} Sales), where vMaxDate = max(Date) or max({1}Date)
If you post your actual expression, we may be able to help you a little more with the syntax.
Regards,
Sean
- Mark as New
- Bookmark
- Subscribe
- Mute
- Subscribe to RSS Feed
- Permalink
- Report Inappropriate Content
I tried that, but I'm getting 0 for all values.
Here is my expression:
Count( {<defdtentry = {"<$(MaxDefDtentry)"}>} distinct CN)
Any ideas?
- Mark as New
- Bookmark
- Subscribe
- Mute
- Subscribe to RSS Feed
- Permalink
- Report Inappropriate Content
Script.
CrossTable(Type,Sales)
Load
Date(Date#(EntryDate,'D/M/YYYY')) as EntryDate,
SalesA,
SalesB
Inline
[
EntryDate,SalesA, SalesB
1/1/2014, 2, 4
1/1/2014, 10, 5
2/1/2014, 1, 2
2/1/2014, 2, 3
2/1/2014, 2, 4
3/1/2014, 1, 2
3/1/2014, 1, 3
];
Create Straight Table
Dimension = Type
Expression
Average Sales
SUM(Sales)/COUNT(Sales)
Average Sales without Max EntryDate
SUM({<EntryDate -= {'$(=Max(EntryDate))'}>}Sales)/COUNT({<EntryDate -= {'$(=Max(EntryDate))'}>}Sales)
Average Sales For Max EntryDate
SUM({<EntryDate = {'$(=Max(EntryDate))'}>}Sales)/COUNT({<EntryDate = {'$(=Max(EntryDate))'}>}Sales)
- Mark as New
- Bookmark
- Subscribe
- Mute
- Subscribe to RSS Feed
- Permalink
- Report Inappropriate Content
What is the value of MaxDefDtentry in variable overview? Given your expression above, MaxDefDtentry should include an "=" in the variable definition. A dollar expansion is done before the expression is evaluated, and in this case without the "=" in the value of the variable the expression is trying to return the distinct count of CN where defdtentry is less than 'some text' rather than the value of the max date.
You can also try: Count( {<defdtentry = {"<$(=Max(defdtentry))"}>} distinct CN)