Unlock a world of possibilities! Login now and discover the exclusive benefits awaiting you.
- Qlik Community
- :
- All Forums
- :
- QlikView App Dev
- :
- Re: Set Analysis Filter Question
- Subscribe to RSS Feed
- Mark Topic as New
- Mark Topic as Read
- Float this Topic for Current User
- Bookmark
- Subscribe
- Mute
- Printer Friendly Page
- Mark as New
- Bookmark
- Subscribe
- Mute
- Subscribe to RSS Feed
- Permalink
- Report Inappropriate Content
Set Analysis Filter Question
Hi all,
I noticed that when I filter by a field in which a plot has dependent set analysis, the plot doesn't properly filter selected data.
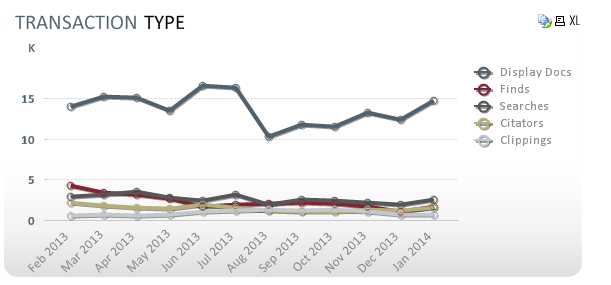
For instance, in the below line graph, I'm summing "transactions" and using set analysis to say something to the effect of "sum where <Field1> is equal to 'Desired_Value'." My dimension is month/year as shown below. Now, when I use a list box to select and filter on one (or multiple) of the Field1 values, none of the lines go away. Since I'm restricting several of the Field1 values, shouldn't it break the set analysis condition and hide the lines?
(Table)
Field1 Transacations
Finds 25
Searches 14
... ...
I realize I could just add Field1 to the dimension field, but I'm curious to know why I'm experiencing this behavior. I've never noticed this before.
- Mark as New
- Bookmark
- Subscribe
- Mute
- Subscribe to RSS Feed
- Permalink
- Report Inappropriate Content
When you restrict something in set analysis then that is fix. For example if in field1 you have encoded where field1 = A, whatever you select in field1 you will get sum of values where it is A, You can use if condition instead if it full fills your requirement