Unlock a world of possibilities! Login now and discover the exclusive benefits awaiting you.
- Qlik Community
- :
- All Forums
- :
- QlikView App Dev
- :
- Re: Set Analysis Help
- Subscribe to RSS Feed
- Mark Topic as New
- Mark Topic as Read
- Float this Topic for Current User
- Bookmark
- Subscribe
- Mute
- Printer Friendly Page
- Mark as New
- Bookmark
- Subscribe
- Mute
- Subscribe to RSS Feed
- Permalink
- Report Inappropriate Content
Set Analysis Help
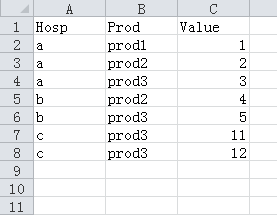
For Example,
I have a table like this:
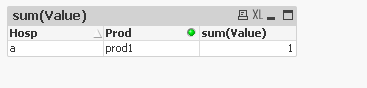
in the qv, when prod1 is selected, the result is like this below:
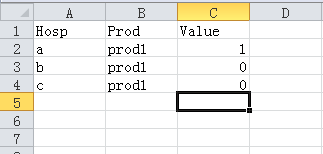
However, I wanna the result like this:
Could anybody help me write the expression?
Thanks in advance.
Accepted Solutions
- Mark as New
- Bookmark
- Subscribe
- Mute
- Subscribe to RSS Feed
- Permalink
- Report Inappropriate Content
How about something like the attached ?
- Mark as New
- Bookmark
- Subscribe
- Mute
- Subscribe to RSS Feed
- Permalink
- Report Inappropriate Content
Attached is the correct display, which is the correct way to show whether hosp a b ,c has a value or null .
- Mark as New
- Bookmark
- Subscribe
- Mute
- Subscribe to RSS Feed
- Permalink
- Report Inappropriate Content
Hi Dear,
Sorry to bother you again.
I have selected Suppress When Value Is Null and Show ALL Values for Hosp in Dimensions.
Bus I still only get one raw for prod1.
Is there anywhere else I need to set for achieving the result of yours?
- Mark as New
- Bookmark
- Subscribe
- Mute
- Subscribe to RSS Feed
- Permalink
- Report Inappropriate Content
How about something like the attached ?
- Mark as New
- Bookmark
- Subscribe
- Mute
- Subscribe to RSS Feed
- Permalink
- Report Inappropriate Content
Hi,
Try like this..
if(IsNull(Value),0,Value) as Value
in scripting part
Thanks
Harsha
- Mark as New
- Bookmark
- Subscribe
- Mute
- Subscribe to RSS Feed
- Permalink
- Report Inappropriate Content
Oh, It's amazing!
How do you make that?
I cannot find any difference in the chart dimension and expression setting.
could you help explain for me?
- Mark as New
- Bookmark
- Subscribe
- Mute
- Subscribe to RSS Feed
- Permalink
- Report Inappropriate Content
Qianyu
Have look at the load script, also pasted in below. In essence :
a) In line load of your test data in table Data
b) Load distinct values of Prod into table Temp
c) Cartesian join of distinct values of Hosp into table Temp
- Table Temp now contains all combinations of Prod and Hosp
d) Outer join table Temp onto table Temp
- Which fills in the missing Prod and Hosp combinations giving them a null() value for Value
Then once you have generated this table creating the Straight table is dead easy as you have observed.
I am an advocate of doing everything one can in the script so as to make the dashboard objects as easy to create and simple as possible.
Data :
LOAD * INLINE [
Hosp, Prod, Value
a, prod1, 1
a, prod2, 2
a, prod3, 3
b, prod2, 4
b, prod3, 5
c, prod3, 11
c, prod3, 12
];
Temp :
load distinct
Prod
resident Data
;
Outer Join ( Temp )
load distinct
Hosp
resident Data
;
outer join ( Data )
load
*
resident Temp
;
drop table Temp ;