Unlock a world of possibilities! Login now and discover the exclusive benefits awaiting you.
- Qlik Community
- :
- All Forums
- :
- QlikView App Dev
- :
- Re: Set Analysis Question
- Subscribe to RSS Feed
- Mark Topic as New
- Mark Topic as Read
- Float this Topic for Current User
- Bookmark
- Subscribe
- Mute
- Printer Friendly Page
- Mark as New
- Bookmark
- Subscribe
- Mute
- Subscribe to RSS Feed
- Permalink
- Report Inappropriate Content
Set Analysis Question
Hello,
I have a question regarding set analysis. I have a Products, a Work Order and a Component table. The Products table contains information for all of our products. The Work Order table contains sales stats. Sometimes we build products by combining several products together. The information of which products make up our built products are contained in the Components table.
Product Table
ProductID
ProductDescription
Work Order
Product ID
OrderQty
Cost
Component
ProductID
ComponentID
I need to create a chart that will show me the Order Qty for a given Product as well as the components of the Product.
I have attached a screenshot of what the chart should look like. I'm thinking that the Set Analysis logic would be something like
sum({1<ProductID={ComponentID}>} OrderQty) for all of the components, but I can't get the formual to work.
Any help would be greatly appreciated!
- « Previous Replies
-
- 1
- 2
- Next Replies »
- Mark as New
- Bookmark
- Subscribe
- Mute
- Subscribe to RSS Feed
- Permalink
- Report Inappropriate Content
However, the expression should still work.
- Mark as New
- Bookmark
- Subscribe
- Mute
- Subscribe to RSS Feed
- Permalink
- Report Inappropriate Content
Can you rephrase : Usage for that Product as well as the Usage for the 3 components
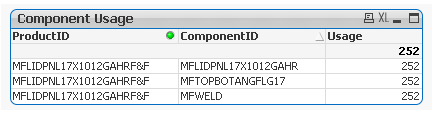
When i added Product ID to that table i got the above result.
Which means per your data model this product has three different components but just one OrderQty.
Can you post an example of how you want the data to look like(in the resultant table)?
- Mark as New
- Bookmark
- Subscribe
- Mute
- Subscribe to RSS Feed
- Permalink
- Report Inappropriate Content
Do you try with aggr(Sum(Qty), Dim1)?
-JFlorian
- Mark as New
- Bookmark
- Subscribe
- Mute
- Subscribe to RSS Feed
- Permalink
- Report Inappropriate Content
Ajay,
I have attached another sample application. If you look on the left hand side, it will show you what results I would like to see.
The table you posted shows the Usage for just the Product ID. That product has three components. Each of these components are in the Products and have records in the Work Orders table. I need to see the Usage for these components.
Again, look at the attached application and see if it makes sense now.
Thank you!
- Mark as New
- Bookmark
- Subscribe
- Mute
- Subscribe to RSS Feed
- Permalink
- Report Inappropriate Content
Now I fully understand. Attached with answer. Check the back-end, made a small change.
Let me know if you run into any issues.
Thanks
AJ
- Mark as New
- Bookmark
- Subscribe
- Mute
- Subscribe to RSS Feed
- Permalink
- Report Inappropriate Content
Ajay,
Thanks for you help! Unfortunately I cannot change the data model.
- Mark as New
- Bookmark
- Subscribe
- Mute
- Subscribe to RSS Feed
- Permalink
- Report Inappropriate Content
I want to thank everyone for their help!
After some digging around the message board and the QlikView for Developers Cookbook I was able to come up with a solution using Set Analysis. I am posting the final application for anyone interested in learning how I solved this problem.
- « Previous Replies
-
- 1
- 2
- Next Replies »