Unlock a world of possibilities! Login now and discover the exclusive benefits awaiting you.
- Qlik Community
- :
- All Forums
- :
- QlikView App Dev
- :
- Re: Set Analysis Syntax
- Subscribe to RSS Feed
- Mark Topic as New
- Mark Topic as Read
- Float this Topic for Current User
- Bookmark
- Subscribe
- Mute
- Printer Friendly Page
- Mark as New
- Bookmark
- Subscribe
- Mute
- Subscribe to RSS Feed
- Permalink
- Report Inappropriate Content
Set Analysis Syntax
Hi everyone... I am trying to determine the correct Set Analysis syntax for the following situation:
My application has two views - one that looks at the sum(WORKFLOW_DURATION) based on the CUR_WORKFLOW_STEP_NAME and one based on the historical WORKFLOW_STEP_NAME.
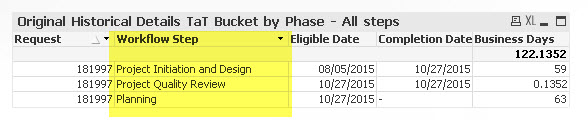
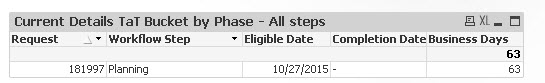
In my example, if you select REQUEST_ID 181997, you can see that the historical WORKFLOW_STEP_NAME chart looks correct.

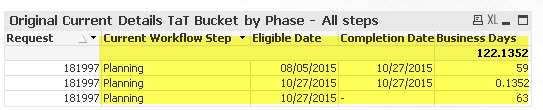
However, the CUR_WORKFLOW_STEP_NAME chart shows the Current Workflow repeating because that's the phase it is currently in but it still sums up the Business Days Workflow Duration for each of the other steps.
I want to see only one line that sums up Business Days Workflow Duration where the CUR_WORKFLOW_STEP_NAME=WORKFLOW_STEP_NAME instead of this:
t's possible that a workflow step could repeat. In the case where CUR_WORKFLOW_STEP_NAME=WORKFLOW_STEP_NAME, I would want to seem the sum of the aggregate workflow duration.
A null Completion date also means a step is current.
Thanks!
- « Previous Replies
-
- 1
- 2
- Next Replies »
Accepted Solutions
- Mark as New
- Bookmark
- Subscribe
- Mute
- Subscribe to RSS Feed
- Permalink
- Report Inappropriate Content
I would add a field in the script:
if(CUR_WORKFLOW_STEP_NAME=WORKFLOW_STEP_NAME, 1, 0) as Flag_CurrentStep
and then in the chart:
sum({<Flag_CurrentStep={1}>}WORKFLOW_DURATION)
-Rob
- Mark as New
- Bookmark
- Subscribe
- Mute
- Subscribe to RSS Feed
- Permalink
- Report Inappropriate Content
Hi,
I think this due to date field
- Mark as New
- Bookmark
- Subscribe
- Mute
- Subscribe to RSS Feed
- Permalink
- Report Inappropriate Content
Or you can use Aggr() and aggregate the sum by request ID so that eligible and completion dates are collapsed:
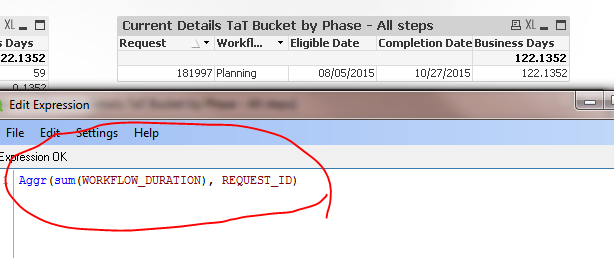
Hope this helps
- Mark as New
- Bookmark
- Subscribe
- Mute
- Subscribe to RSS Feed
- Permalink
- Report Inappropriate Content
but the total for Planning should not be 123. It should be 64.
- Mark as New
- Bookmark
- Subscribe
- Mute
- Subscribe to RSS Feed
- Permalink
- Report Inappropriate Content
Why 64? Can you explain the logic a little bit?
Thanks
- Mark as New
- Bookmark
- Subscribe
- Mute
- Subscribe to RSS Feed
- Permalink
- Report Inappropriate Content
Sorry, 63, rather.
- Mark as New
- Bookmark
- Subscribe
- Mute
- Subscribe to RSS Feed
- Permalink
- Report Inappropriate Content
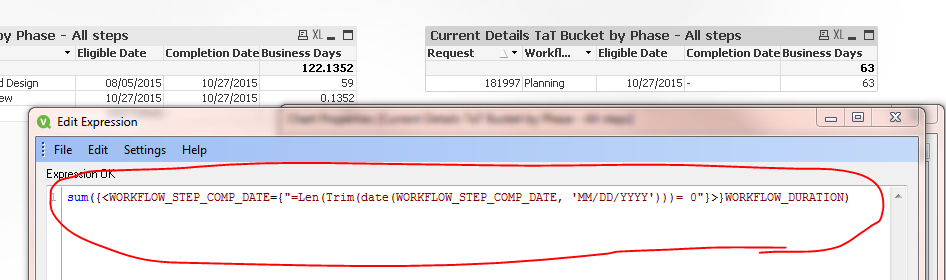
Ok. Let me know if the below helps:
- Mark as New
- Bookmark
- Subscribe
- Mute
- Subscribe to RSS Feed
- Permalink
- Report Inappropriate Content
Not sure what the expression is doing here but it doesn't seem to work on my Historical view when I select 168442, for example.
- Mark as New
- Bookmark
- Subscribe
- Mute
- Subscribe to RSS Feed
- Permalink
- Report Inappropriate Content
I thought you were trying to show the uncompleted lines that didn't have completion dates. If not, can you explain again why you would want to show only 63? I guess I am just not understanding that part.
Thanks
- Mark as New
- Bookmark
- Subscribe
- Mute
- Subscribe to RSS Feed
- Permalink
- Report Inappropriate Content
Sorry for the confusion... the goal is twofold:
1. For the Current chart, show the aggregated sum of Workflow Duration per REQUEST_ID for the CUR_WORKFLOW_STEP. So, in the case the current workflow step was repeated at some other point, sum them up per request.
2. For the Historical chart, show the aggregated sum of Workflow Duration per REQUEST_ID for each WORKFLOW_STEP_NAME. So, in the case the workflow step was repeated at some other point, sum them up per request.
The dates are the dates each step was eligible for action and where action was completed. A step with a null end date thereby means it is still current.
In the example of 181997, this was correct:
But it doesn't work for 178316. For the Current view, I would expect it to show one row for Step Close Out since 8/20/15 (something like 111 days in my example). For historical, I would expect it to show each step something like these in yellow:

- « Previous Replies
-
- 1
- 2
- Next Replies »