Unlock a world of possibilities! Login now and discover the exclusive benefits awaiting you.
- Qlik Community
- :
- All Forums
- :
- QlikView App Dev
- :
- Set Analysis in Chart Dimension
- Subscribe to RSS Feed
- Mark Topic as New
- Mark Topic as Read
- Float this Topic for Current User
- Bookmark
- Subscribe
- Mute
- Printer Friendly Page
- Mark as New
- Bookmark
- Subscribe
- Mute
- Subscribe to RSS Feed
- Permalink
- Report Inappropriate Content
Set Analysis in Chart Dimension
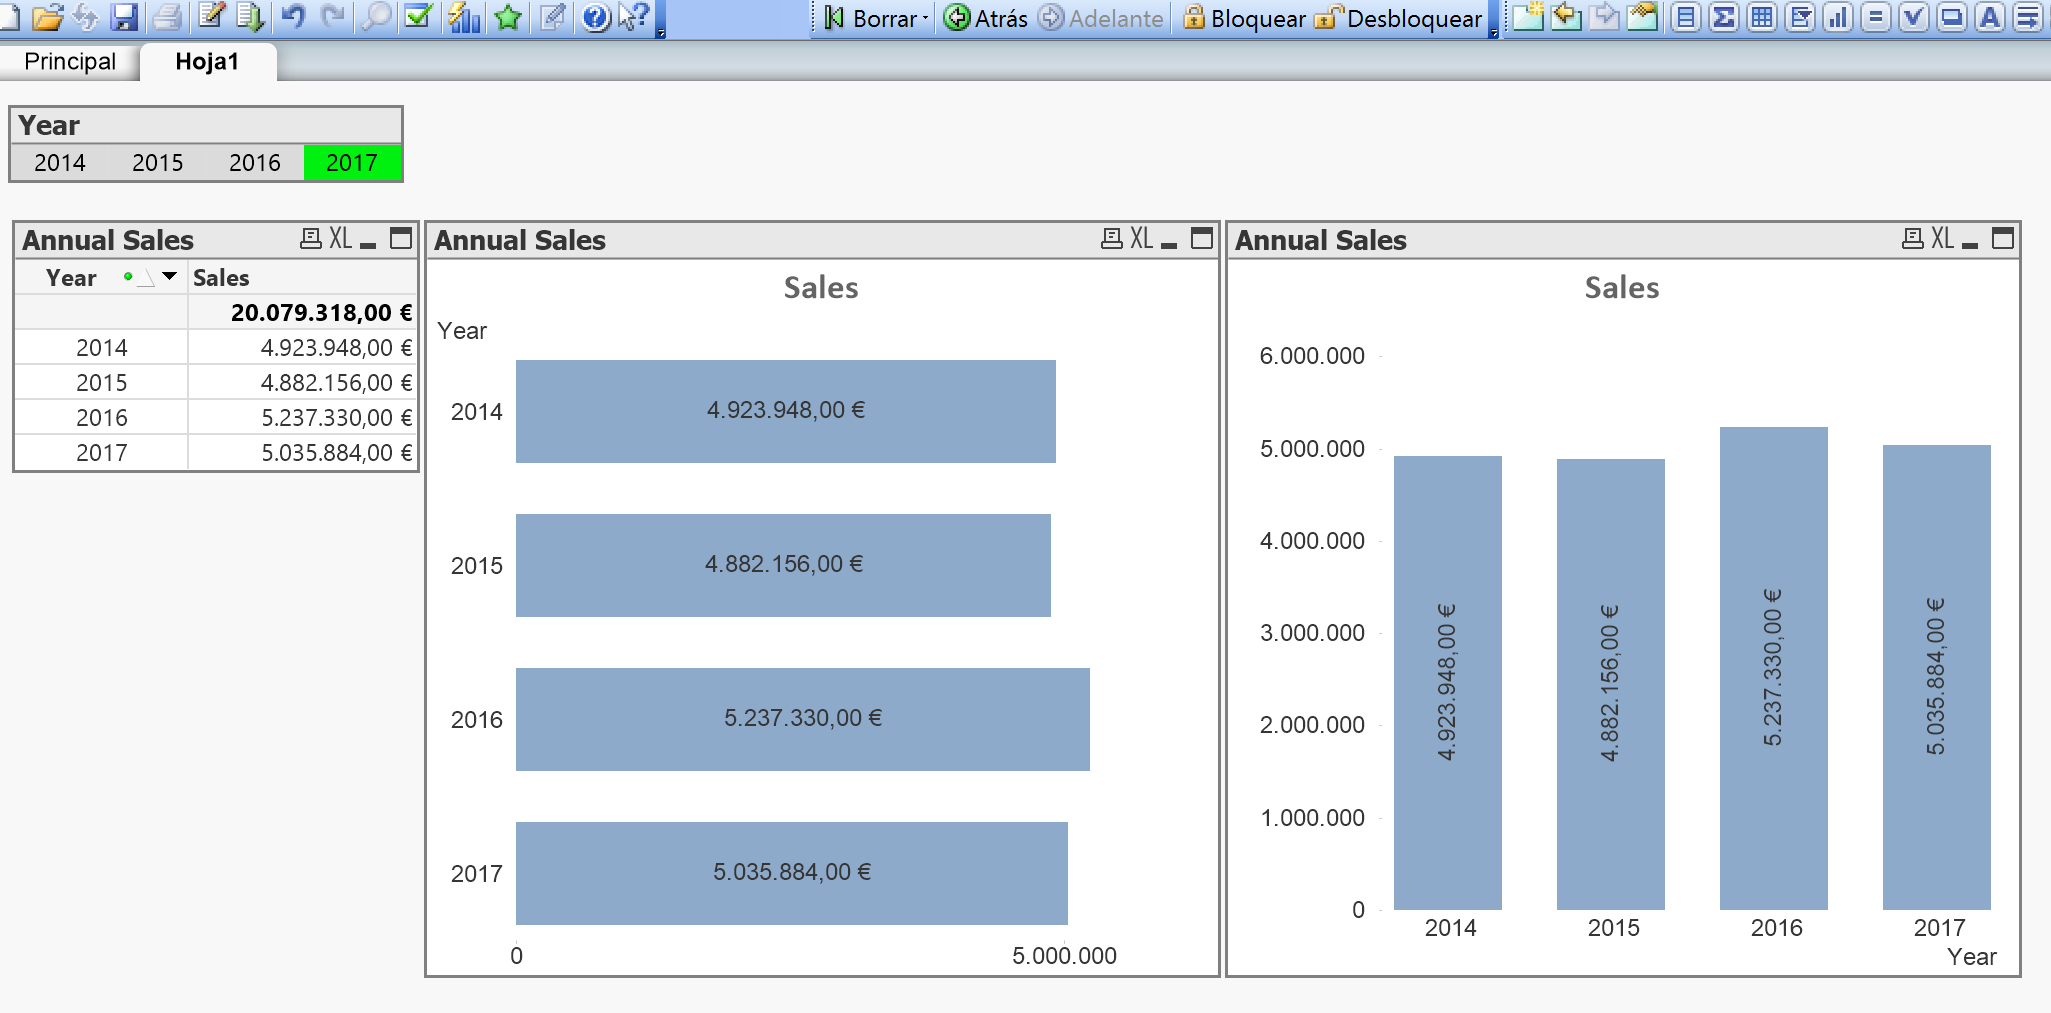
I need a chart, that use all years in my data, unless a selected year.
Can i use a Set Analysis as Chart Dimension overriding selected years?

In example above, i have a table with values of the last 6 years.There i'm working with set analysis. This works. Now i want to draw a chart (line or bar) with the dimension "YEAR", but in the chart, the selection of the year 2017 should be overriden, like the straight table.
Thank for your help!
Rolf
Accepted Solutions
- Mark as New
- Bookmark
- Subscribe
- Mute
- Subscribe to RSS Feed
- Permalink
- Report Inappropriate Content
Hi,
You can use Sum({<Year= >}Sales) in your Expression.
This will not consider your year selection.
Please confirm if this is what you wan't.
Cheers,
Pankaj
- Mark as New
- Bookmark
- Subscribe
- Mute
- Subscribe to RSS Feed
- Permalink
- Report Inappropriate Content
May be like this
Sum({<Jahr>}Netto_Nettowert)
- Mark as New
- Bookmark
- Subscribe
- Mute
- Subscribe to RSS Feed
- Permalink
- Report Inappropriate Content
Hi,
You can use Sum({<Year= >}Sales) in your Expression.
This will not consider your year selection.
Please confirm if this is what you wan't.
Cheers,
Pankaj
- Mark as New
- Bookmark
- Subscribe
- Mute
- Subscribe to RSS Feed
- Permalink
- Report Inappropriate Content
Is this you need?