Unlock a world of possibilities! Login now and discover the exclusive benefits awaiting you.
- Qlik Community
- :
- All Forums
- :
- QlikView App Dev
- :
- Re: Set Analysis or Join
- Subscribe to RSS Feed
- Mark Topic as New
- Mark Topic as Read
- Float this Topic for Current User
- Bookmark
- Subscribe
- Mute
- Printer Friendly Page
- Mark as New
- Bookmark
- Subscribe
- Mute
- Subscribe to RSS Feed
- Permalink
- Report Inappropriate Content
Set Analysis or Join
Table1 has three fields, a Ticker, Price, and Reference
Table2 has two fields, a Ticker and PickReference
I would like to display in a Straight Table the Ticker, PickReference number, and the corresponding Price
This statement works if only one Ticker is selected: =Sum({<Reference={$(=[PickReference])} >}Price)
Is there a way to change this statement to show the entire table, all tickers, all referenced prices?
Or, would a Join during the load be a better solution?
Attached is my project.
Thanks!
Accepted Solutions
- Mark as New
- Bookmark
- Subscribe
- Mute
- Subscribe to RSS Feed
- Permalink
- Report Inappropriate Content
- Mark as New
- Bookmark
- Subscribe
- Mute
- Subscribe to RSS Feed
- Permalink
- Report Inappropriate Content
If PickReference and Reference contain the same data then rename PickReference to Reference. You could then also join the two tables so you end up with only one. It's not necessary, but an option.
The set expression calculates one set per chart, not a set per row. So it will very likely not do what you expect.
talk is cheap, supply exceeds demand
- Mark as New
- Bookmark
- Subscribe
- Mute
- Subscribe to RSS Feed
- Permalink
- Report Inappropriate Content
Hi Chris,
Try the expression.:
FieldValue('Price', FieldIndex('Reference' ,PickReference) )
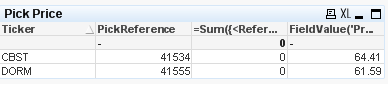
Please, see attached.
Regards
- Mark as New
- Bookmark
- Subscribe
- Mute
- Subscribe to RSS Feed
- Permalink
- Report Inappropriate Content
If it has to be a sum, you can try something like:
=Sum({<Reference=PickReference >}Price)
Problem is you lose the chart if you clear PickReference selections..
- Mark as New
- Bookmark
- Subscribe
- Mute
- Subscribe to RSS Feed
- Permalink
- Report Inappropriate Content
Use the formula:
Sum(if(Reference=PickReference,Price))
- Mark as New
- Bookmark
- Subscribe
- Mute
- Subscribe to RSS Feed
- Permalink
- Report Inappropriate Content
Close! But the DORM value is returning the CBST value for that date. Looks like they are all returning the CBST values.
- Mark as New
- Bookmark
- Subscribe
- Mute
- Subscribe to RSS Feed
- Permalink
- Report Inappropriate Content
CBST is returning a value of 126, I don't know where that is coming from.
My formula, close to what you suggested, works when only one Ticker is selected:
=Sum({<Reference={$(=[PickReference])} >}Price)
- Mark as New
- Bookmark
- Subscribe
- Mute
- Subscribe to RSS Feed
- Permalink
- Report Inappropriate Content
Wow! Simplicity!
Thanks!