Unlock a world of possibilities! Login now and discover the exclusive benefits awaiting you.
- Qlik Community
- :
- All Forums
- :
- QlikView App Dev
- :
- Re: Set Analysis with variable
- Subscribe to RSS Feed
- Mark Topic as New
- Mark Topic as Read
- Float this Topic for Current User
- Bookmark
- Subscribe
- Mute
- Printer Friendly Page
- Mark as New
- Bookmark
- Subscribe
- Mute
- Subscribe to RSS Feed
- Permalink
- Report Inappropriate Content
Set Analysis with variable
Hi all,
I have tried to solve what I thought would be a simple task for a while now and I must be missing something.
I have defined two variables:
beforeDate = 2018-10-30
lastDate = MAX({$<dateCol={"<=$(=beforeDate)"}>}dateCol)
In a chart i have no trouble using "=$(lastDate)" in order to get the most current date before "beforeDate".
But when I want to use it in a Set analysis i get into trouble.
This is my current expression:
Sum({$<dateCol={"=$(=lastDate)"}>}costCol)
What am I missing?
- « Previous Replies
-
- 1
- 2
- Next Replies »
- Mark as New
- Bookmark
- Subscribe
- Mute
- Subscribe to RSS Feed
- Permalink
- Report Inappropriate Content
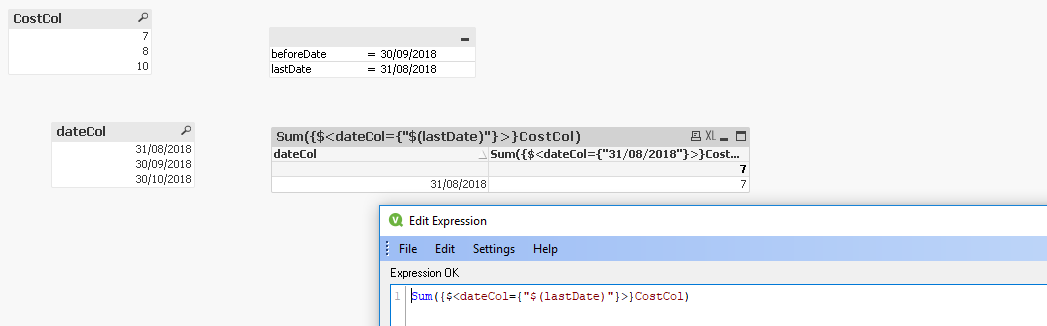
Is this the kind of behaviour you are expecting?
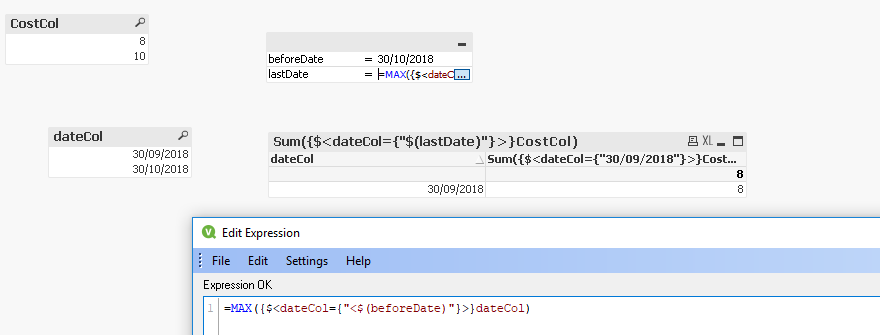
If so then I think issues may have spread from date formats (so I had to change to my local format) & possibly some extra '='s signs (although possibly not).
Something I picked up from a book was that in a straight table if you don't override the label you get to see the dollar expanded formula (so you can see to the right of dateCol in straight table above), which may also help.
Regards,
Chris.
- Mark as New
- Bookmark
- Subscribe
- Mute
- Subscribe to RSS Feed
- Permalink
- Report Inappropriate Content
In a set expression field modifier,
= {"=..."}
is used for an expression search, something you don't want or need if you want to filter a known date.
What do you see in a chart using
=lastDate
? The date, correctly formatted same way as dateCol?
Then try
=Sum({$<dateCol={'$(=lastDate)'}>} costCol)
Besides this, read
- Mark as New
- Bookmark
- Subscribe
- Mute
- Subscribe to RSS Feed
- Permalink
- Report Inappropriate Content
Hi Stefan and Chris,
First of all a big thank you for trying to help me out it is much appreciated!
Even though I tried to amnipulate both the date formats and reading up on the very good articles you posted Stefan I can't seem to get it right.
I attatch a testfile and the source data if someone would like to take a look.
- Mark as New
- Bookmark
- Subscribe
- Mute
- Subscribe to RSS Feed
- Permalink
- Report Inappropriate Content
Hi Chris,
After reading Stefans articles I do think that an extra $ is needed but I want to use the variable in the expression and not use a static date as you do in the right column and thats where the wierd things start to happen. The filter doesn't seeem to work for me and I end up with the total value instead of the sum of a record that I want.
I have sent an updated set of files below if you would like to take a look at it 
- Mark as New
- Bookmark
- Subscribe
- Mute
- Subscribe to RSS Feed
- Permalink
- Report Inappropriate Content
- Mark as New
- Bookmark
- Subscribe
- Mute
- Subscribe to RSS Feed
- Permalink
- Report Inappropriate Content
Hi Patrick,
I will try to open the files later. Not sure what you mean by static date, adding another date to my toy application & then updating in the text box (beforeDate);
Am I missing something?
Cheers,
Chris.
- Mark as New
- Bookmark
- Subscribe
- Mute
- Subscribe to RSS Feed
- Permalink
- Report Inappropriate Content
Oh i might have been a bit unclear,
what i mean is that it seems that the set expression in the right column of the table is static and thats where I want to use the variable.
I have data that are not updated every month. so one project could have lastDate 2018-08-01 and a second project might have a lastDate of 2018-09-01. so by using the variable to find the first date before a selected date I am hoping to be able to get data from different periods in the same column.
Hopefully it is clearer when opening the files.
My best regards
- Mark as New
- Bookmark
- Subscribe
- Mute
- Subscribe to RSS Feed
- Permalink
- Report Inappropriate Content
Patrick, the dollar sign expansion as well as the set analysis is evaluated only once per chart, not per dimension line, if that's what you expect.
So if you use for example project as dimension, the dollar sign expansion won't be re-evaluated per project.
- Mark as New
- Bookmark
- Subscribe
- Mute
- Subscribe to RSS Feed
- Permalink
- Report Inappropriate Content
Hi Patrick,
We are both on personal edition, so I can't open your file.
However I did have a think about what I think you are trying to do & I now remember why I hate dates in QlikView.
So in a straight table;
max({$<dateCol={"<$(beforeDate)"}>}dateCol)
Will return the max date before the 'beforeDate' for each account.
So in my very simple model I can then return the relevant sums using the below;
FirstSortedValue({$<dateCol={"<$(beforeDate)"}>} aggr(sum({$<dateCol={"<$(beforeDate)"}>}costCol), Account, dateCol),-dateCol)
So you can see for A the date & value for 30th Sep is returned, but B (where there is no data for Sep) returns 31st Aug instead.
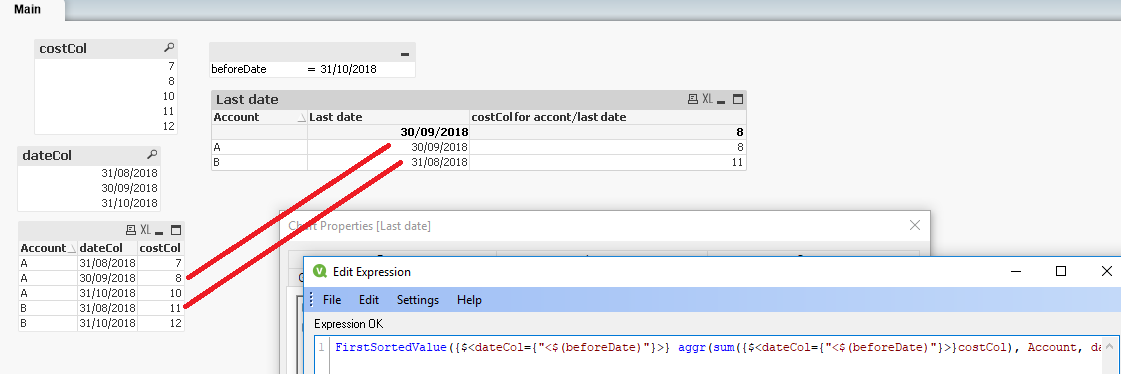
My script is really simple & not based on your spreadsheet;
data:
LOAD * INLINE [
Account, dateCol, costCol
A, 31/10/2018, 10
A, 30/09/2018, 8
A, 31/08/2018, 7
B, 31/10/2018, 12
B, 31/08/2018, 11
];
Hope this helps,
Chris.
- « Previous Replies
-
- 1
- 2
- Next Replies »