Unlock a world of possibilities! Login now and discover the exclusive benefits awaiting you.
- Qlik Community
- :
- All Forums
- :
- QlikView App Dev
- :
- Set Analysis
- Subscribe to RSS Feed
- Mark Topic as New
- Mark Topic as Read
- Float this Topic for Current User
- Bookmark
- Subscribe
- Mute
- Printer Friendly Page
- Mark as New
- Bookmark
- Subscribe
- Mute
- Subscribe to RSS Feed
- Permalink
- Report Inappropriate Content
Set Analysis
Hello Experts,
I have the following code,
Fact:
LOAD *
Inline
[
Key, Value
1,10
1,20
2,5
];
DIMENSION:
LOAD *
Inline
[
Key, Brand
1,ABC
2,ABC1
];
Exit Script;
My requirement is whenever I select ABC from Dimension, I need a value of both ABC + ABC1 value and
| BRAND | SUM(VALUE) |
|---|---|
| ABC | 35 |
| ABC1 | 0 |
How to achieve this unique requirement? I don't mind to use any type of set Analysis.
I want to acheive this unique requirement.
Please help.
Thanks
PR
- « Previous Replies
-
- 1
- 2
- Next Replies »
Accepted Solutions
- Mark as New
- Bookmark
- Subscribe
- Mute
- Subscribe to RSS Feed
- Permalink
- Report Inappropriate Content
- Mark as New
- Bookmark
- Subscribe
- Mute
- Subscribe to RSS Feed
- Permalink
- Report Inappropriate Content
Use this script and use BRAND as chart dimension instead of Brand.
Fact:
LOAD *
Inline
[
Key, Value
1,10
1,20
2,5
];
DIMENSION:
LOAD *
Inline
[
Key, Brand, BRAND
1,ABC, ABC
2,ABC1, ABC
0,,ABC1
];
talk is cheap, supply exceeds demand
- Mark as New
- Bookmark
- Subscribe
- Mute
- Subscribe to RSS Feed
- Permalink
- Report Inappropriate Content
Hi,
Try this Set Analysis
=Sum( {$<Brand={"*ABC*"}>}Value)
- Mark as New
- Bookmark
- Subscribe
- Mute
- Subscribe to RSS Feed
- Permalink
- Report Inappropriate Content
Hi Gysbert,
I cannot change the values in the script, this INLINE data is just sample of my Band data.
I have brands like this
ABC,
ABC1
ABC2
.
.
.
XYZ
XYZ1
XYZ2.. etc
I need show values at ABC & XYZ group level.
| Brand | Sum(Brand) |
| ABC | 30 |
| ABC1 | 0 |
| ABC2 | 0 |
| XYZ | 40 |
| XYZ1 | 0 |
| XYZ2 | 0 |
Not sure how to address it.
Please help.
- Mark as New
- Bookmark
- Subscribe
- Mute
- Subscribe to RSS Feed
- Permalink
- Report Inappropriate Content
Hi Gabriel,
Thank you for your reply,
I tried this one, but this is not fulfilling my requirement. Any other suggestion.
Thanks
PR
- Mark as New
- Bookmark
- Subscribe
- Mute
- Subscribe to RSS Feed
- Permalink
- Report Inappropriate Content
Ultimately this is a data cleansing issue more than a set analysis issue and if you will have many charts that use this logic you should look at cleaning the data in the load script if at all possible. There is obviously two data values combined in the Brand field.
Having said that, this expression will do what you want. It adds up every value associated with the selected brand.
sum({1<Brand = {'$(=getFieldSelections(Brand))*'}>} Value)
- Mark as New
- Bookmark
- Subscribe
- Mute
- Subscribe to RSS Feed
- Permalink
- Report Inappropriate Content
maybe with a calculated dim
=PurgeChar(Brand, '0123456789')
- Mark as New
- Bookmark
- Subscribe
- Mute
- Subscribe to RSS Feed
- Permalink
- Report Inappropriate Content
Hi Max,
Thank you for your reply, unfortunately my data is not linke that, that's only for example. My data is as below
ABC
ABC-ASL
ABC-NBC
XYZ
XYZ-ASL
XYZ-NBC
XYZ-NML
IN THIS, I want to show all brands in straight table but sum of the ABC group values at ABC, and remaining ABC groups should be zero. Same for XYZ too.
Not sure how to solve this
Please advise
- Mark as New
- Bookmark
- Subscribe
- Mute
- Subscribe to RSS Feed
- Permalink
- Report Inappropriate Content
May be something like attached
I tried with valuelist..
- Mark as New
- Bookmark
- Subscribe
- Mute
- Subscribe to RSS Feed
- Permalink
- Report Inappropriate Content
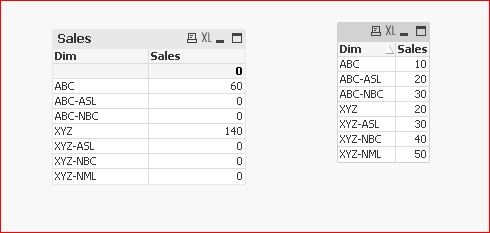
Hi,
another solution can be
Test:
LOAD * INLINE [
Dim, Sales
ABC, 10
ABC-ASL, 20
ABC-NBC, 30
XYZ, 20
XYZ-ASL, 30
XYZ-NBC, 40
XYZ-NML, 50
];
JOIN
LOAD SubField(Dim,'-',1) as Dim,
sum(Sales) as TotalSales
Resident Test
Group by SubField(Dim,'-',1);
Then in front end
take straight table
Dimension -> Dim
Expression ->
1: Sum(Sales)
2: Sum(Total Sales)
If you don't required sum(Sales) then hide it in Presentation tab but don't remove it.
Regards
Please appreciate our Qlik community members by giving Kudos for sharing their time for your query. If your query is answered, please mark the topic as resolved 🙂
- « Previous Replies
-
- 1
- 2
- Next Replies »