Unlock a world of possibilities! Login now and discover the exclusive benefits awaiting you.
- Qlik Community
- :
- All Forums
- :
- QlikView App Dev
- :
- Set Analysis
- Subscribe to RSS Feed
- Mark Topic as New
- Mark Topic as Read
- Float this Topic for Current User
- Bookmark
- Subscribe
- Mute
- Printer Friendly Page
- Mark as New
- Bookmark
- Subscribe
- Mute
- Subscribe to RSS Feed
- Permalink
- Report Inappropriate Content
Set Analysis
Helle Community,
I have read the tutorial to set analysis of Tom Mackay. Unfortunately I did not become really smart to solve my problem  .
.
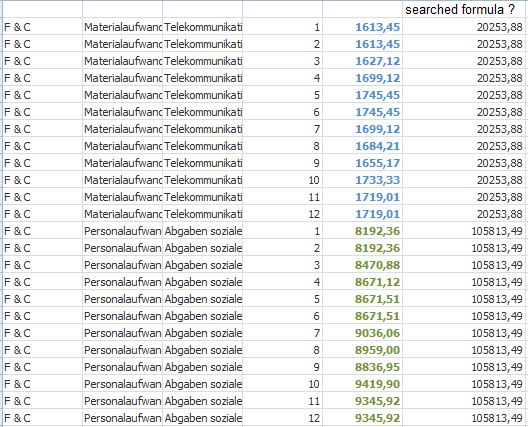
How can I aggregating the below table is always the sum of the 12 months in the chart?
Calculation of the values in Table 1-12 sums 20253.88 etc... see disired table.
Thank you !
Accepted Solutions
- Mark as New
- Bookmark
- Subscribe
- Mute
- Subscribe to RSS Feed
- Permalink
- Report Inappropriate Content
One question:
why do you divide your sum 1-12 months by 10?
I noticed that you have several records per combination of your dimensions, sometimes 10, sometimes 5, sometimes more than 10.
Maybe try this:
sum(total< PD_OBERBEREICH, PD_KOSTENGRUPPE, PD_CAROTKONTONAME> PD_WERT ) / count(PD_WERT)
to get an average value.
Stefan
- Mark as New
- Bookmark
- Subscribe
- Mute
- Subscribe to RSS Feed
- Permalink
- Report Inappropriate Content
I think you could just use a sum with appropriate total qualifier:
I assume you have three dimensions in your chart like Dim1, Dim2, Dim3 (where Dim1 has values like F&C, Dim2 like Personalaufwand... and Dim3 are the Months).
Then you could use
sum(total<Dim1,Dim2> VALUEFIELD)
where VALUEFIELD is the field containing the numbers your blue and green values are based on.
Hope this helps,
Stefan
- Mark as New
- Bookmark
- Subscribe
- Mute
- Subscribe to RSS Feed
- Permalink
- Report Inappropriate Content
Hi Stefan,
Thank you for your support. I have five dimensions in my diagram. I tried your example like:
In the diagram there are five dimensions. I tried your example on the following:
sum(total< PD_OBERBEREICH, PD_KOSTENGRUPPE, PD_CAROTKONTONAME> PD_WERT )
But the values are not always correct. See Screenshot
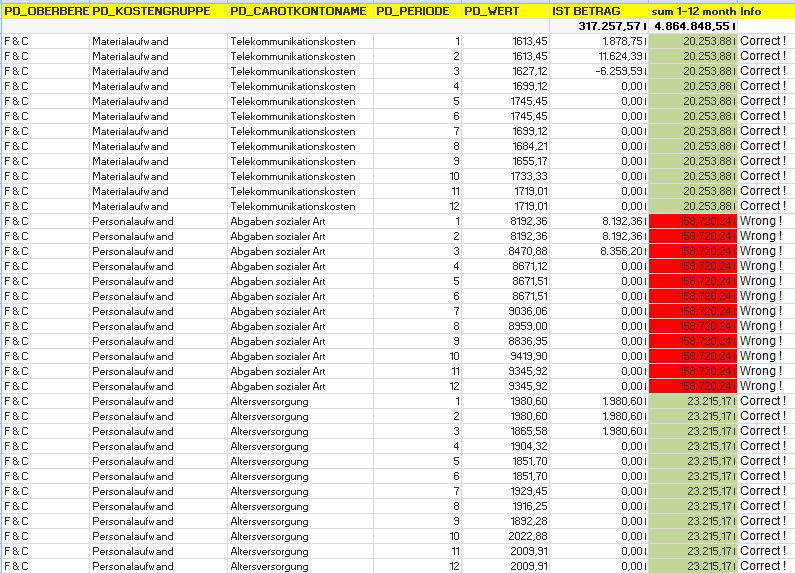
Or see my qvw file
- Mark as New
- Bookmark
- Subscribe
- Mute
- Subscribe to RSS Feed
- Permalink
- Report Inappropriate Content
One question:
why do you divide your sum 1-12 months by 10?
I noticed that you have several records per combination of your dimensions, sometimes 10, sometimes 5, sometimes more than 10.
Maybe try this:
sum(total< PD_OBERBEREICH, PD_KOSTENGRUPPE, PD_CAROTKONTONAME> PD_WERT ) / count(PD_WERT)
to get an average value.
Stefan
- Mark as New
- Bookmark
- Subscribe
- Mute
- Subscribe to RSS Feed
- Permalink
- Report Inappropriate Content
Hi Stefan,
many thanks for the tip. Now it fits.
I thought at first that the number formatting deviates one decimal place.
But you have correctly identified the problem. The records are more than 5 or 10 times, therefore the correct solution is to divide by the quantity.
Thanks again
