Unlock a world of possibilities! Login now and discover the exclusive benefits awaiting you.
- Qlik Community
- :
- All Forums
- :
- QlikView App Dev
- :
- Re: Set Y max based on which columns have values i...
- Subscribe to RSS Feed
- Mark Topic as New
- Mark Topic as Read
- Float this Topic for Current User
- Bookmark
- Subscribe
- Mute
- Printer Friendly Page
- Mark as New
- Bookmark
- Subscribe
- Mute
- Subscribe to RSS Feed
- Permalink
- Report Inappropriate Content
Set Y max based on which columns have values in X
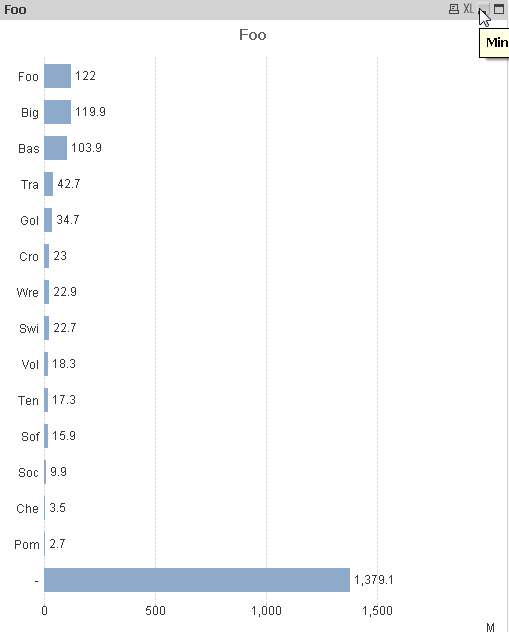
I've got a bar chart that's aggregating the sum of values for people who fall into several categories--being able to see the sum for folks who don't fall into any category is important too.
However, the total for folks who don't fall into any category is so much larger than the other categories that the chart isn't particularly useful (see the screenshot below). I can set a static Y min fairly easily, but I'd like the chart to scale properly based on my selections--what I'd really like to do is set a static Y min based on the biggest value of Y where X is not null. I'm guessing I could use some sort of set analysis expression to do this, something like = max( aggr( sum( {< Xvalue = { isNotNull( Xvalue) } >} Yvalue ), Xvalue)), but I'm sure that's not exactly right.
Suggestions?
. 
Accepted Solutions
- Mark as New
- Bookmark
- Subscribe
- Mute
- Subscribe to RSS Feed
- Permalink
- Report Inappropriate Content
Try this:
=Max({<Xvalue = {"=Len(Trim(Xvalue)) > 0"}>} Aggr(Sum(Yvalue), Xvalue))
- Mark as New
- Bookmark
- Subscribe
- Mute
- Subscribe to RSS Feed
- Permalink
- Report Inappropriate Content
Try this:
=Max({<Xvalue = {"=Len(Trim(Xvalue)) > 0"}>} Aggr(Sum(Yvalue), Xvalue))
- Mark as New
- Bookmark
- Subscribe
- Mute
- Subscribe to RSS Feed
- Permalink
- Report Inappropriate Content
That did it--thanks so much!
- Mark as New
- Bookmark
- Subscribe
- Mute
- Subscribe to RSS Feed
- Permalink
- Report Inappropriate Content
Looking at the issue again, you might have also resolved this by selecting 'Suppress When Value Is Null' on the dimension tab with this expression -> Sum(Yvalue) or Max(Aggr(Sum(Yvalue), Xvalue))