Unlock a world of possibilities! Login now and discover the exclusive benefits awaiting you.
- Qlik Community
- :
- All Forums
- :
- QlikView App Dev
- :
- Re: Set analysis-How to only show results greater ...
- Subscribe to RSS Feed
- Mark Topic as New
- Mark Topic as Read
- Float this Topic for Current User
- Bookmark
- Subscribe
- Mute
- Printer Friendly Page
- Mark as New
- Bookmark
- Subscribe
- Mute
- Subscribe to RSS Feed
- Permalink
- Report Inappropriate Content
Set analysis-How to only show results greater than a certain value
Hello
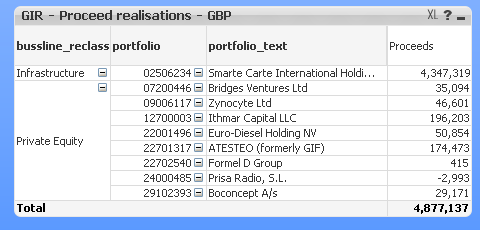
The set analysis below produces the table below.
I would only really like to show any portfolio where the amount is greater than 500,000 ie rounded to the nearest 1million,
I would like to do this in set analysis as I would need to reproduce in N Printing as a formula
sum({< proceeds = {"Proceeds"}>} [GPR GBP])*-1
Would anyone be able to help with this?
Many thanks
Paul
- « Previous Replies
-
- 1
- 2
- Next Replies »
- Mark as New
- Bookmark
- Subscribe
- Mute
- Subscribe to RSS Feed
- Permalink
- Report Inappropriate Content
oh let me check,might be a spelling mistake
- Mark as New
- Bookmark
- Subscribe
- Mute
- Subscribe to RSS Feed
- Permalink
- Report Inappropriate Content
Yes thanks for your help Sunny (I just had to change business to bussline.
Thanks you've helped me a lot and I am very grateful!
- Mark as New
- Bookmark
- Subscribe
- Mute
- Subscribe to RSS Feed
- Permalink
- Report Inappropriate Content
Sorry another question, would you know why when I put this formula into N Printing it comes out as 1327000000, but it works in QlikView?
- Mark as New
- Bookmark
- Subscribe
- Mute
- Subscribe to RSS Feed
- Permalink
- Report Inappropriate Content
Do you have selections in QlikView dashboard?
- Mark as New
- Bookmark
- Subscribe
- Mute
- Subscribe to RSS Feed
- Permalink
- Report Inappropriate Content
Yes I think that's it. Many thanks. You're a star!
- « Previous Replies
-
- 1
- 2
- Next Replies »