Unlock a world of possibilities! Login now and discover the exclusive benefits awaiting you.
- Qlik Community
- :
- All Forums
- :
- QlikView App Dev
- :
- Re: Set analysis for Previous Year sales for a par...
- Subscribe to RSS Feed
- Mark Topic as New
- Mark Topic as Read
- Float this Topic for Current User
- Bookmark
- Subscribe
- Mute
- Printer Friendly Page
- Mark as New
- Bookmark
- Subscribe
- Mute
- Subscribe to RSS Feed
- Permalink
- Report Inappropriate Content
Set analysis for Previous Year sales for a particular company
Hello All,
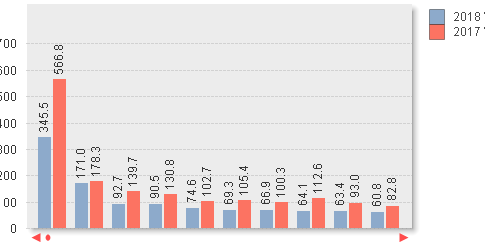
I'm trying to create a comparison bar chart in qlikview , where it shows the sales between two years, selected year and previous year.
I was able to create the chart for all companies but when I tried to filter the chart to a particular company , I have issue .
This is the First primary expression for the selected year for the company "Abc" - Works fine
sum({<Company.Name={'Abc'}>}[Value])
This is the Second primary expression for the previous year for the company "Abc" - Have Issue Here
Sum({$<Year={$(=max(Year)-1)}>}{<Company.Name={'Abc'}>}[Value])
also tried from this website https://www.analyticsvidhya.com/blog/2014/01/set-analysis-qlikview/ but no luck with it either.
Please advice on this regard.
Expected output look. ---
Accepted Solutions
- Mark as New
- Bookmark
- Subscribe
- Mute
- Subscribe to RSS Feed
- Permalink
- Report Inappropriate Content
Try like:
=Sum({$<Year={$(=max(Year)-1)} , Company.Name={'Abc'}>}[Value])
If this doesn't work, try to share your sample qvw.
- Mark as New
- Bookmark
- Subscribe
- Mute
- Subscribe to RSS Feed
- Permalink
- Report Inappropriate Content
Try like:
=Sum({$<Year={$(=max(Year)-1)} , Company.Name={'Abc'}>}[Value])
If this doesn't work, try to share your sample qvw.
- Mark as New
- Bookmark
- Subscribe
- Mute
- Subscribe to RSS Feed
- Permalink
- Report Inappropriate Content
Hello, please try this;
sum(
{$<
Year={"$(=max(Year)-1)"},
Company.Name={'Abc'}
>}
[Value]
)
- Mark as New
- Bookmark
- Subscribe
- Mute
- Subscribe to RSS Feed
- Permalink
- Report Inappropriate Content
works perfectly , thank you so much
- Mark as New
- Bookmark
- Subscribe
- Mute
- Subscribe to RSS Feed
- Permalink
- Report Inappropriate Content
thanks for the reply