Unlock a world of possibilities! Login now and discover the exclusive benefits awaiting you.
- Qlik Community
- :
- All Forums
- :
- QlikView App Dev
- :
- Set analysis help
- Subscribe to RSS Feed
- Mark Topic as New
- Mark Topic as Read
- Float this Topic for Current User
- Bookmark
- Subscribe
- Mute
- Printer Friendly Page
- Mark as New
- Bookmark
- Subscribe
- Mute
- Subscribe to RSS Feed
- Permalink
- Report Inappropriate Content
Set analysis help
Hi Experts,
Can any one please help me on below requirement.
I have build Monthly Trend chart in the below image with expression
=Sum(Aggr((Sum({<Type={'A'}>}Amount)*Avg(A1%)),Date,Dept,Branch))
This chart contains Monthly Total Amount.
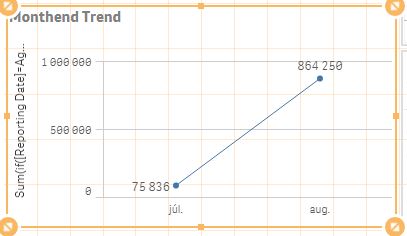
In the second chart i.e., Monthend Trend need to show each month Max(Date) Total amount in the trend instead of all the dates Total Amount in each month.
I have tried below expression for only Monthend Trend in each month
=Sum(Aggr((Sum({<Type={'A'},Date={'$(=Date(Max(Date),'DD/MM/YYYY'))'}>}Amount)*
Avg({<Date={'$(=Date(Max(Date),'DD/MM/YYYY'))'}>}A1%)),Date,Dept,Branch))
But only Sep Month Max(Date) Total amount getting correctly remaining months showing Zero values.
Please help on this.
Thanks in advance.
- « Previous Replies
-
- 1
- 2
- Next Replies »
Accepted Solutions
- Mark as New
- Bookmark
- Subscribe
- Mute
- Subscribe to RSS Feed
- Permalink
- Report Inappropriate Content
A:
Load
MonthName(Date) as MonthYear,
Date,
Sale;
LOAD * INLINE [
Date, Sale
1/22/2018, 10
1/25/2018, 15
2/21/2018, 21
2/27/2018, 11
];
b:
Load
MonthYear,
date(max(Date),'M/D/YYYY') as New_Date
resident A
group by MonthYear;
UI:
Dimension: MonthYear
Exp: sum({<Date=p(New_Date)>}Sale)
Br,
KC
KC
- Mark as New
- Bookmark
- Subscribe
- Mute
- Subscribe to RSS Feed
- Permalink
- Report Inappropriate Content
Don't use set analysis for this, try using 'if' statement instead. Set analysis gets evaluated once for a chart and you can't make it work row-wise even using aggr().
- Mark as New
- Bookmark
- Subscribe
- Mute
- Subscribe to RSS Feed
- Permalink
- Report Inappropriate Content
Hi tresesco,
Thanks for your reply.
Could you please help me how to use below set analysis in if statement in my scenario
=Sum(Aggr((Sum({<Type={'A'},Date={'$(=Date(Max(Date),'DD/MM/YYYY'))'}>}Amount)*
Avg({<Date={'$(=Date(Max(Date),'DD/MM/YYYY'))'}>}A1%)),Date,Dept,Branch))
- Mark as New
- Bookmark
- Subscribe
- Mute
- Subscribe to RSS Feed
- Permalink
- Report Inappropriate Content
May be like this:
Dimension: Month(Date)
if(Date=Max(Date), sum({Type={'A'}>}Amount)*Avg(A1%))
Br,
KC
KC
- Mark as New
- Bookmark
- Subscribe
- Mute
- Subscribe to RSS Feed
- Permalink
- Report Inappropriate Content
Could you share your sample app?
- Mark as New
- Bookmark
- Subscribe
- Mute
- Subscribe to RSS Feed
- Permalink
- Report Inappropriate Content
Hi jyothish8807,
Thanks for your reply.
After applying the above expression I am getting only Jun value and remaining months showing null.
when aggr by Date,Dept,Branch removed, then Jun value also getting wrong so modified the expression like below
=if(Date=Max(Date),Sum(Aggr((Sum({<Type={'A'}>}Amount)*Avg(A1%)),Date,Dept,Branch))
then getting Jun value correct but remaining months showing null.
Last time September value getting now only jun value getting in trend.
In the below expression Sep value is getting correctly and remaining months showing zero but when I have applied filter on those months those are showing values instead of zero.
=Sum(Aggr((Sum({<Type={'A'},Date={'$(=Date(Max(Date),'DD/MM/YYYY'))'}>}Amount)*
Avg({<Date={'$(=Date(Max(Date),'DD/MM/YYYY'))'}>}A1%)),Date,Dept,Branch))
- Mark as New
- Bookmark
- Subscribe
- Mute
- Subscribe to RSS Feed
- Permalink
- Report Inappropriate Content
Hi Mahitha,
Try this sample
Br,
KC
KC
- Mark as New
- Bookmark
- Subscribe
- Mute
- Subscribe to RSS Feed
- Permalink
- Report Inappropriate Content
A:
Load
MonthName(Date) as MonthYear,
Date,
Sale;
LOAD * INLINE [
Date, Sale
1/22/2018, 10
1/25/2018, 15
2/21/2018, 21
2/27/2018, 11
];
b:
Load
MonthYear,
date(max(Date),'M/D/YYYY') as New_Date
resident A
group by MonthYear;
UI:
Dimension: MonthYear
Exp: sum({<Date=p(New_Date)>}Sale)
Br,
KC
KC
- Mark as New
- Bookmark
- Subscribe
- Mute
- Subscribe to RSS Feed
- Permalink
- Report Inappropriate Content
Use Expression:
Sum(if([Reporting Date]=Aggr(nodistinct Max( [Reporting Date]),Month), Aggr((Sum({<Type={'A'}>}MTM)*
Avg(CalColumn1Percent)),Month,[Reporting Date],Name,Folder)))
- Mark as New
- Bookmark
- Subscribe
- Mute
- Subscribe to RSS Feed
- Permalink
- Report Inappropriate Content
Thanks a lot jyothish8807
Its working in my scenario like below
=Sum(Aggr((Sum({<Type={'A'},Date=p(New_Date)>}Amount)*
Avg({<Date=p(New_Date)>}A1%)),Date,Dept,Branch))
- « Previous Replies
-
- 1
- 2
- Next Replies »