Unlock a world of possibilities! Login now and discover the exclusive benefits awaiting you.
- Qlik Community
- :
- All Forums
- :
- QlikView App Dev
- :
- Re: Set analysis in a simple table: How to do refe...
- Subscribe to RSS Feed
- Mark Topic as New
- Mark Topic as Read
- Float this Topic for Current User
- Bookmark
- Subscribe
- Mute
- Printer Friendly Page
- Mark as New
- Bookmark
- Subscribe
- Mute
- Subscribe to RSS Feed
- Permalink
- Report Inappropriate Content
Set analysis in a simple table: How to do refer to chart dimensions?
Hi Guys,
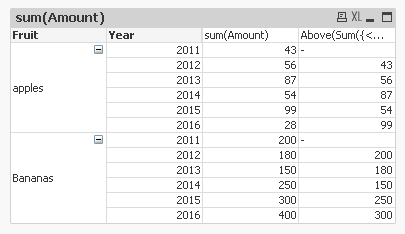
I need to compare annual data and wanted to have a simple table with the sum(Amount) of each year and the sum of last year, while the year is one of the chart dimensions.
I tried to calculate the sum of each last year for each year in the dimension as
sum({$<Year= {"$(=$(Year)-1)"}>} Amount)
It does not work. But why and what would be right solution?
I have attached a small example to your convience.
Thanks,
Andreas
Accepted Solutions
- Mark as New
- Bookmark
- Subscribe
- Mute
- Subscribe to RSS Feed
- Permalink
- Report Inappropriate Content
- Mark as New
- Bookmark
- Subscribe
- Mute
- Subscribe to RSS Feed
- Permalink
- Report Inappropriate Content
maybe with this expression
above(sum(Amount))
- Mark as New
- Bookmark
- Subscribe
- Mute
- Subscribe to RSS Feed
- Permalink
- Report Inappropriate Content
Rangesum(Sum(Amount),above(sum(Amount)))
If a post helps to resolve your issue, please accept it as a Solution.
- Mark as New
- Bookmark
- Subscribe
- Mute
- Subscribe to RSS Feed
- Permalink
- Report Inappropriate Content
Or this if you plan to make selections
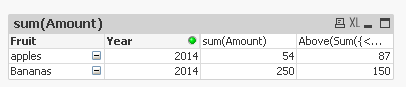
Above(Sum({<Year>}Amount)) * Avg(1)
Without Selection
With Selection
- Mark as New
- Bookmark
- Subscribe
- Mute
- Subscribe to RSS Feed
- Permalink
- Report Inappropriate Content
Thanks Massimo,
I had forgotten this expression. Your was the first answer that resolved the initial problem.
Selecting years is a problem though.
Andreas
- Mark as New
- Bookmark
- Subscribe
- Mute
- Subscribe to RSS Feed
- Permalink
- Report Inappropriate Content
Thanks Sunny,
Above(Sum({<Year>}Amount)) * Avg(1)
So by adding the "empty expression" of Avg(1), for which the selection"year" is not disregarded, the whole expression becomes filtered by the selection again?
Nice trick.
Thanks
Andreas
- Mark as New
- Bookmark
- Subscribe
- Mute
- Subscribe to RSS Feed
- Permalink
- Report Inappropriate Content
Yes sir... 
- Mark as New
- Bookmark
- Subscribe
- Mute
- Subscribe to RSS Feed
- Permalink
- Report Inappropriate Content
Hi Guys,
thanks for all your help.
Please find an updated version of the example with all the answers side-by-side.
- Mark as New
- Bookmark
- Subscribe
- Mute
- Subscribe to RSS Feed
- Permalink
- Report Inappropriate Content
Are you just compiling and sharing our responses or is there a question for us ?
- Mark as New
- Bookmark
- Subscribe
- Mute
- Subscribe to RSS Feed
- Permalink
- Report Inappropriate Content
Just sharing. My attempt to give something back to the community.