Unlock a world of possibilities! Login now and discover the exclusive benefits awaiting you.
- Qlik Community
- :
- All Forums
- :
- QlikView App Dev
- :
- Re: Set analysis not working across time
- Subscribe to RSS Feed
- Mark Topic as New
- Mark Topic as Read
- Float this Topic for Current User
- Bookmark
- Subscribe
- Mute
- Printer Friendly Page
- Mark as New
- Bookmark
- Subscribe
- Mute
- Subscribe to RSS Feed
- Permalink
- Report Inappropriate Content
Set analysis not working across time
I have an application that measures open and resolved help ticket incidents (cases).
I have a MasterCalendar dimension with many fields, 2 of which are: Date and MonthYear. Ex, 01/17/2017 and Jan2017
I have an expression below, which calculates correctly when a MonthYear is selected, but does not work (greatly reduces the sum calculated), when not selected and data is summed across MonthYear in chart showing the measure across time. All chart types show the same result, so think of a straight table here.
The columns [Entered Status Date] and %ResolvedDateNotNull, are dates, always populated, and are stored in the fact table. [Case Count] is stored as a 1, and is also in the fact, Facts are linked to the MasterCalendar through a MasterCalendarLink table, on a field named %MasterCalendarLink. MasterCalendarLink has the %EntryDateFlag. That linkage works fine, and I have used this date design in many applications in which there are multiple date "roles" across the same facts. In this case, %EntryDateFlag is the "role" used for [Entered Status Date]
What this below does it to show open incidents (not resolved during the MonthYear in the chart) across time.
sum({$<%EntryDateFlag={1}, [Entered Status Date]={"<=$(=max(Date))"}, %ResolvedDateNotNull={">$(=max(Date))"}>} [Case Count] )
Dave
- Mark as New
- Bookmark
- Subscribe
- Mute
- Subscribe to RSS Feed
- Permalink
- Report Inappropriate Content
Correction to the just previous reply:
The Entered Date would have to be less than or equal than the max(DateKey) for the Month.
Dave
- Mark as New
- Bookmark
- Subscribe
- Mute
- Subscribe to RSS Feed
- Permalink
- Report Inappropriate Content
Sunny,
To more accurately reflect the data model, I added the MasterCalendarLink table, and added more dates to the calendar. Adding a DateType broke your expression, but DateType is necessary in the data model. Your expression still calculates, but is not correct. I put notes, and added another chart for clarity on why DateType was added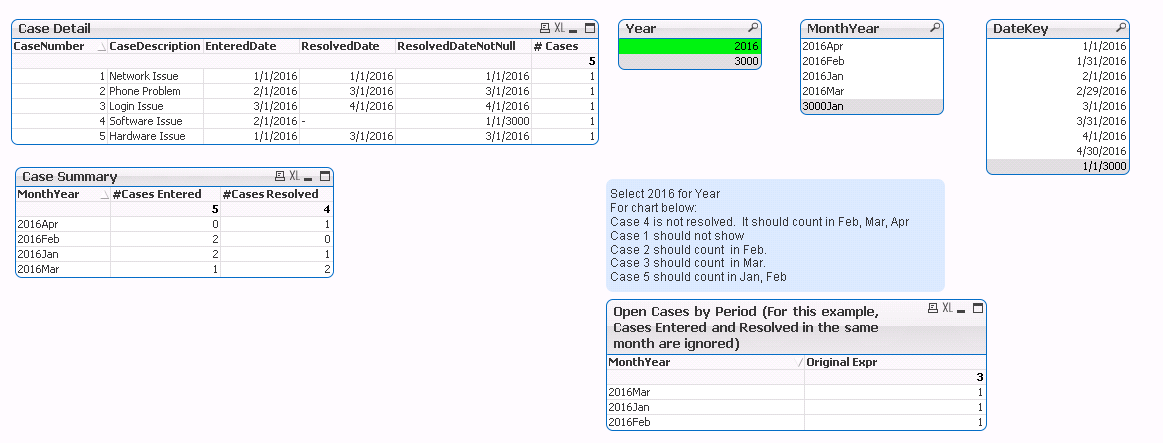 .
.
Dave
- Mark as New
- Bookmark
- Subscribe
- Mute
- Subscribe to RSS Feed
- Permalink
- Report Inappropriate Content
A solution with IntervalMatch

Script changes
and also
Fct_Main:
Load
CaseNumber,
Date(EnteredDate) as EnteredDate,
Date(ResolvedDate) as ResolvedDate,
Date(AddMonths(ResolvedDateNotNull, -1)) as ResolvedDateNotNull,
AutoNumberHash128(EnteredDate,ResolvedDateNotNull) as MasterCalendarLink
;
Load * inline [
CaseNumber,EnteredDate,ResolvedDate,ResolvedDateNotNull
1,1/1/2016,1/1/2016,1/1/2016
2,2/1/2016,3/1/2016,3/1/2016
3,3/1/2016,4/1/2016,4/1/2016
4,2/1/2016,,1/1/3000
5,1/1/2016,3/1/2016,3/1/2016
];
and
//NoConcatenate
//MasterCalendarLink:
//Load DISTINCT
//AutoNumberHash128(EnteredDate,ResolvedDateNotNull) as MasterCalendarLink,
//EnteredDate as DateKey,
//'Entered' as DateType
//Resident Fct_Main
//;
//
//Concatenate (MasterCalendarLink)
//Load DISTINCT
//AutoNumberHash128(EnteredDate,ResolvedDateNotNull) as MasterCalendarLink,
//ResolvedDateNotNull as DateKey,
//'Resolved' as DateType
//Resident Fct_Main
//;
MasterCalendarLink:
IntervalMatch(DateKey)
LOAD EnteredDate,
ResolvedDateNotNull
Resident Fct_Main;
- Mark as New
- Bookmark
- Subscribe
- Mute
- Subscribe to RSS Feed
- Permalink
- Report Inappropriate Content
I personally would prefer the while loop here, if you need to create a reference date per date in your interval.
The result would be the same, but I think a while loop could perform better (you don't need to match against any master calendar dates that are outside the interval) and you can also easily create flags for e.g. closing and entry date in the link table itself (thus allowing also counting only new / closed tickets in the same chart using Reference date as dimension).
- Mark as New
- Bookmark
- Subscribe
- Mute
- Subscribe to RSS Feed
- Permalink
- Report Inappropriate Content
David, why are you trying to avoid the date link table with the reference dates?
Sure, it will create another table, but even with some thousand cases lasting some years, it will still be only some million records.
You could use a date island to use as dimension and use advanced aggregation and a condition to check against your interval, but I think this will essentially just blow up the chart memory instead of your data model. And run time performance will be worse.
- Mark as New
- Bookmark
- Subscribe
- Mute
- Subscribe to RSS Feed
- Permalink
- Report Inappropriate Content
Yes, I noticed that Sunny's solution did not factor in the DateType and my MasterCalendarLink table, as you suggest in your comment:
closing and entry date in the link table itself (thus allowing also counting only new / closed tickets in the same chart using Reference date as dimension).
However, I am amazed at how fast he was able to meet the requirement I needed! I also learned a bit about intervalmatch. If intervalMatch can work, somehow, it allows for a much leaner data model.
The issue with the while loop is that, there are millions of cases, and if the average case closes in 3 days for example, that adds a 3X factor on those rows in the bridge table.
I may just rethink this, and calculate a "Case age in days", and then report by MonthYear with <DateType={'Entered'}>. I think Users will get the picture. I can still show CaseCount along with that.
Dave
- Mark as New
- Bookmark
- Subscribe
- Mute
- Subscribe to RSS Feed
- Permalink
- Report Inappropriate Content
Sunny,
I just added a reply to Stefan. Please see that. I have not given up on IntervalMatch, however. I just need it to also take in consideration multiple date types (Entered, Resolved, Responded,etc) to be able to accomodate other charts where I sum case counts by those. I am very impressed by how fast you have created these solutions!
Dave
- Mark as New
- Bookmark
- Subscribe
- Mute
- Subscribe to RSS Feed
- Permalink
- Report Inappropriate Content
Creation of flags using While Loop or IntervalMatch is going to require a lot of resources.... I have done that within the sample as it was simple to do it from less records, but you can take a look

Was not sure how to check for Responded as there was not Responded date I think.....
- Mark as New
- Bookmark
- Subscribe
- Mute
- Subscribe to RSS Feed
- Permalink
- Report Inappropriate Content
The Date link table I use when I have multiple date "roles" within the same fact. I do need that, as in this example, I have roles of Resolved and Entered, and need separate measure for that under a single master calendar. I am trying to avoid an additional CaseOpenIntersection table which would have a row for each MonthYear (period) that case is open. That is what would add millions of rows. I am hoping to avoid that by using CaseAge accoss period entered.
- Mark as New
- Bookmark
- Subscribe
- Mute
- Subscribe to RSS Feed
- Permalink
- Report Inappropriate Content
Sunny
Sorry for the late response. I looked at your intervalmatch table, and it looks like it might parallel the separate table that I think might be best to implement if I need it. That table would just loop tickets, and create a separate row for each period that a ticket is still open (between entered date and resolved date). I am hoping my idea to use a [Ticket Age] metric, and just show # tickets by age over time (based on Entered Date), will suffice. If it does, I do not need to build a separate "Ticket Period Open" table.
Thanks so much for your help on this.
Dave