Unlock a world of possibilities! Login now and discover the exclusive benefits awaiting you.
- Qlik Community
- :
- All Forums
- :
- QlikView App Dev
- :
- Re: Set analysis query
- Subscribe to RSS Feed
- Mark Topic as New
- Mark Topic as Read
- Float this Topic for Current User
- Bookmark
- Subscribe
- Mute
- Printer Friendly Page
- Mark as New
- Bookmark
- Subscribe
- Mute
- Subscribe to RSS Feed
- Permalink
- Report Inappropriate Content
Set analysis query
could someone correct whats wrong in the below formula used:
sum
({$<FACT_TYPE={'INSPECTION'},Period_Path=,
Period_Year = {">=$(=$(v_Last_Year))<=$(=(max(Period_Year)))"} ,InspectionType={'ECY'},
DeficienceMainGroupCode={"=$(=$<IF ( Period_Year=$(=$(v_Last_Year)),DeficienceMainGroupCode where
DeficienceMainGroupCode={'Stowaways'},DeficienceGroupCode where DeficienceGroupCode={'Stowaways'})>)"}
>}NbInspection);
- Tags:
- new_to_qlikview
- Mark as New
- Bookmark
- Subscribe
- Mute
- Subscribe to RSS Feed
- Permalink
- Report Inappropriate Content
What are you trying to do in the highlighted part of the code?
=Sum({$<FACT_TYPE={'INSPECTION'}, Period_Path=, Period_Year = {">=$(v_Last_Year)<=$(=(max(Period_Year)))"}, InspectionType={'ECY'}, DeficienceMainGroupCode={"=$(=$<IF ( Period_Year=$(=$(v_Last_Year)),DeficienceMainGroupCode where
DeficienceMainGroupCode={'Stowaways'},DeficienceGroupCode where DeficienceGroupCode={'Stowaways'})>)"}>}NbInspection);
I don't think this can be done within the set analysis. May be if you explain what you are trying to achieve, we can help you with something that will work.
Best,
Sunny
- Mark as New
- Bookmark
- Subscribe
- Mute
- Subscribe to RSS Feed
- Permalink
- Report Inappropriate Content
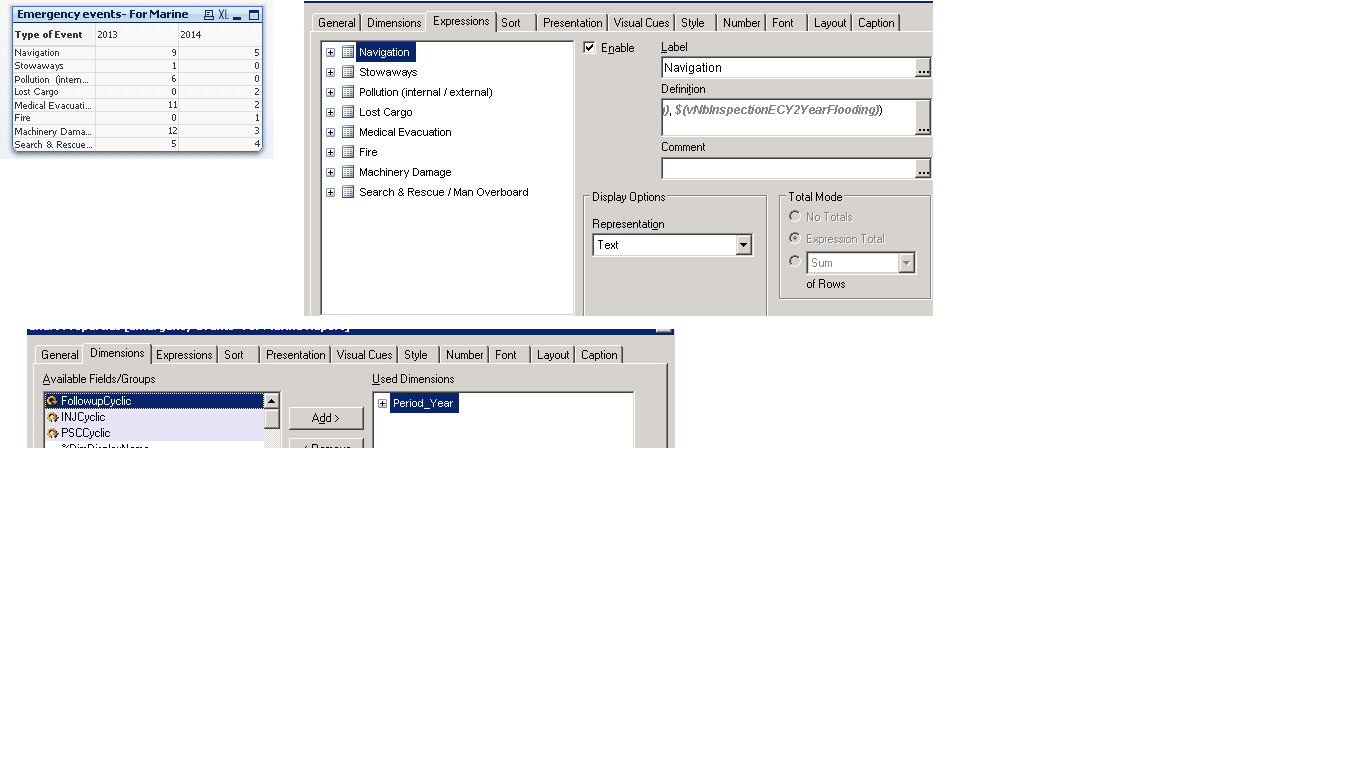
Hello .... Basically noe i have a pivot table:
dimension: period_year
expressions:( to calculate differnt " type of events"; ex: storeways and the formula used for this expressions is:
LET vNbInspectionECY2YearStowaways = 'sum({'&chr(36)&'<FACT_TYPE={' & chr(39) & 'INSPECTION' & chr(39) & '},DeficienceMainGroupCode={' & chr(39) & 'Stowaways' & chr(39) & '},Period_Path=,Period_Year = {">='&chr(36)&'(='&chr(36)&'(v_Last_Year))<='&chr(36)&'(=(max(Period_Year)))"} ,InspectionType={' & chr(39) & 'ECY' & chr(39) & '}>}NbInspection)';
so, in my pivot table i will have three columns:
1)type of events
2) previous Period_Year -> and the corresponding value for that year for the corresponding type of event will be displayed in that
3)Period_Year -> -> and the corresponding value for that year for the corresponding type of event will be displayed in that
so, with one formula being used for each " type of events", we get two values (one for the previous year and one for the current year);
but now i want to use " DeficienceGroupCode" for the previous year and "DeficienceMainGroupCode" while calculating the current year; hence trying to use the formula:
=Sum({$<FACT_TYPE={'INSPECTION'}, Period_Path=, Period_Year = {">=$(v_Last_Year)<=$(=(max(Period_Year)))"}, InspectionType={'ECY'}, DeficienceMainGroupCode={"=$(=$<IF ( Period_Year=$(=$(v_Last_Year)),DeficienceMainGroupCode where
DeficienceMainGroupCode={'Stowaways'},DeficienceGroupCode where DeficienceGroupCode={'Stowaways'})>)"}>}NbInspection);
- Mark as New
- Bookmark
- Subscribe
- Mute
- Subscribe to RSS Feed
- Permalink
- Report Inappropriate Content
Maybe try this:
=Sum({$<FACT_TYPE={'INSPECTION'}, Period_Path=, Period_Year = {">=$(v_Last_Year)<=$(=(max(Period_Year)))"}, InspectionType={'ECY'}, DeficienceMainGroupCode = p({<Period_Year = {"$(=Max(Period_Year))"}, DeficienceMainGroupCode = {'Stowaways'}>}), DeficienceGroupCode = p({<Period_Year = {"$(v_Last_Year)"}, DeficienceGroupCode = {'Stowaways'}>})}>}NbInspection);
- Mark as New
- Bookmark
- Subscribe
- Mute
- Subscribe to RSS Feed
- Permalink
- Report Inappropriate Content
Hello ..
thanks for your response, but still there seems to be no luck with
Sum
({$<
FACT_TYPE={'INSPECTION'}, Period_Path=, Period_Year = {">=$(v_Last_Year)<=$(=(max(Period_Year)))"}, InspectionType={'ECY'},
DeficienceMainGroupCode = p({<Period_Year = {"$(=Max(Period_Year))"}, DeficienceMainGroupCode = {'Stowaways'}>}),
DeficienceGroupCode = p({<Period_Year = {"$(v_Last_Year)"}, DeficienceGroupCode = {'Stowaways'}>})
>}NbInspection);
no values are being shown.. and there seems to be no separate coulmns for the previous and current year as before.
- Mark as New
- Bookmark
- Subscribe
- Mute
- Subscribe to RSS Feed
- Permalink
- Report Inappropriate Content
It would be a lot easier to try and understand what you are trying to accomplish if you provided a sample QVW. It is quite impossible make any reasonable assumption base don a expression and details on what result you get and what you expect. A sample QVW would for example also clarify what you are expanding from your variable.
I have a counter question for you. Where have you seen that a construction like this would work in QlikView? Personally I can not even begin to understand what you are trying to do with this syntax.
=$(=$<IF ( Period_Year=$(=$(v_Last_Year))
My suggestion is that you start over with a basic aggregation. Then add a simple set expression. Add static value for your set modifiers. When your static values work, change them one by one with your "dynamic" dollar expansions. When something fails rollback and review what might be wrong. Don't just dump everything in your expression at once, unless you know it will work.
- Mark as New
- Bookmark
- Subscribe
- Mute
- Subscribe to RSS Feed
- Permalink
- Report Inappropriate Content
I agree, a sample here would be very useful to solve your query.
Best,
Sunny
- Mark as New
- Bookmark
- Subscribe
- Mute
- Subscribe to RSS Feed
- Permalink
- Report Inappropriate Content
Hello Toni,
currentlyi have a pivot table with:
dimension: period_year
expressions: (type of events)-> (ex: storeways, navigation etc) and one such formula used for this currently is:
LET vNbInspectionECY2YearStowaways = 'sum({'&chr(36)&'<FACT_TYPE={' & chr(39) & 'INSPECTION' & chr(39) & '},DeficienceMainGroupCode={' & chr(39) & 'Stowaways' & chr(39) & '},Period_Path=,Period_Year = {">='&chr(36)&'(='&chr(36)&'(v_Last_Year))<='&chr(36)&'(=(max(Period_Year)))"} ,InspectionType={' & chr(39) & 'ECY' & chr(39) & '}>}NbInspection)';
so this will result in a pivot table with one column having the "type of event", the next two will be v_Last_Year and Period_Year respctively and these two columns will have the sum value for the corresponding "type of events".
ie. the same formula used to calculate the value for both the years, cause we are taking into consideration
:Period_Year = {">='&chr(36)&'(='&chr(36)&'(v_Last_Year))<='&chr(36)&'(=(max(Period_Year)))"},
but current requiremnt is for the "v_Last_Year", we need to use the filed: "DeficienceMainGroupCode"; but for "max(Period_Year), we need to use the filed: "DeficienceGroupCode";
so could you please suggest?
- Mark as New
- Bookmark
- Subscribe
- Mute
- Subscribe to RSS Feed
- Permalink
- Report Inappropriate Content
- Mark as New
- Bookmark
- Subscribe
- Mute
- Subscribe to RSS Feed
- Permalink
- Report Inappropriate Content
When looking at cases like this it is very valuable to be able to look at the data and evaluate possible solution in the QlikView desktop client. An image does not help me in assisting you very much, as I do not have time to enter all your details into a QVW in order to analyze your question/problem.
In additional to the sample QVW, please provide details on the expected result. For example assume your expression is accurate, what result (numerical values) are you expecting to see int he chart? This will help any one looking at the question to validate their suggestion actually addresses your question properly.