Unlock a world of possibilities! Login now and discover the exclusive benefits awaiting you.
- Qlik Community
- :
- All Forums
- :
- QlikView App Dev
- :
- Re: Set analysis to get max Month per year in a ch...
- Subscribe to RSS Feed
- Mark Topic as New
- Mark Topic as Read
- Float this Topic for Current User
- Bookmark
- Subscribe
- Mute
- Printer Friendly Page
- Mark as New
- Bookmark
- Subscribe
- Mute
- Subscribe to RSS Feed
- Permalink
- Report Inappropriate Content
Set analysis to get max Month per year in a chart.
How can I do this in set analysis? I want to get the latest month per year.
| Year | Max(Month) | Amount | Comment |
| 2015 | 12 | $100.00 | Amount for Dec 2015 |
| 2016 | 7 | $200.00 | Amount for July 2015 |
| 2017 | - | $0.00 |
If I use this expression the max month is always 12.
SUM({< Month= {"$(=max({Month))"}>} Amount)
Result.
| Year | Max(Month) | Amount |
| 2015 | 12 | $100.00 |
| 2016 | 7 | 0 |
| 2017 | - | 0 |
expected result should be this.
| Year | Max(Month) | Amount |
| 2015 | 12 | $100.00 |
| 2016 | 7 | $200.00 |
| 2017 | - | $0.00 |
- « Previous Replies
-
- 1
- 2
- Next Replies »
- Mark as New
- Bookmark
- Subscribe
- Mute
- Subscribe to RSS Feed
- Permalink
- Report Inappropriate Content
i need to have another column which gets the total for the year (Profit).
The column Outstanding needs to get the sum of the latest month for the year. Or the max month depends on the user selection.
LOAD * INLINE [
Year, Month, Outstanding, Profit
2015, 1, 300, 100
2015, 2, 1200, 100
2015, 3, 300, 100
2015, 10, 200, 100
2015, 11, 200, 100
2015, 12, 200, 100
2015, 12, 700, 100
2016, 1, 200, 200
2016, 2, 600, 200
2016, 3, 100, 200
2016, 3, 200, 200
];
Data is this...
| Data | |||
| Year | Month | Outstanding | Sales |
| 2015 | 1 | 300 | 100 |
| 2015 | 2 | 120 | 100 |
| 2015 | 3 | 300 | 100 |
| 2015 | 10 | 200 | 100 |
| 2015 | 11 | 200 | 100 |
| 2015 | 12 | 200 | 100 |
| 2015 | 12 | 700 | 100 |
| 2016 | 1 | 200 | 200 |
| 2016 | 2 | 600 | 200 |
| 2016 | 3 | 100 | 200 |
| 2016 | 3 | 200 | 200 |
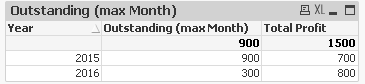
Expected Result | |||
| Year | Month (hide Month if possible) | Outstanding (Max Month) | Total Sales |
| 2015 | 12 | 900 | 700 |
| 2016 | 3 | 300 | 800 |
- Mark as New
- Bookmark
- Subscribe
- Mute
- Subscribe to RSS Feed
- Permalink
- Report Inappropriate Content
i need to have another column which gets the total for the year (Profit).
The column Outstanding needs to get the sum of the latest month for the year. Or the max month depends on the user selection.
LOAD * INLINE [
Year, Month, Outstanding, Profit
2015, 1, 300, 100
2015, 2, 1200, 100
2015, 3, 300, 100
2015, 10, 200, 100
2015, 11, 200, 100
2015, 12, 200, 100
2015, 12, 700, 100
2016, 1, 200, 200
2016, 2, 600, 200
2016, 3, 100, 200
2016, 3, 200, 200
];
Data is this...
| Data | |||
| Year | Month | Outstanding | Profit |
| 2015 | 1 | 300 | 100 |
| 2015 | 2 | 120 | 100 |
| 2015 | 3 | 300 | 100 |
| 2015 | 10 | 200 | 100 |
| 2015 | 11 | 200 | 100 |
| 2015 | 12 | 200 | 100 |
| 2015 | 12 | 700 | 100 |
| 2016 | 1 | 200 | 200 |
| 2016 | 2 | 600 | 200 |
| 2016 | 3 | 100 | 200 |
| 2016 | 3 | 200 | 200 |
Expected Result | |||
| Year | Month (hide Month if possible) | Outstanding (Max Month) | Total Profit |
| 2015 | 12 | 900 | 700 |
| 2016 | 3 | 300 | 800 |
- Mark as New
- Bookmark
- Subscribe
- Mute
- Subscribe to RSS Feed
- Permalink
- Report Inappropriate Content
Try:
FirstSortedValue(Aggr(Sum(Outstanding),Year,Month), -Aggr(Month, Year, Month))
Please be careful of marking the 'correct answer' the right one, so that other people searching for similar solution is not misdirected.
- Mark as New
- Bookmark
- Subscribe
- Mute
- Subscribe to RSS Feed
- Permalink
- Report Inappropriate Content
See attached file Milan. It is a straight able so you can easily hide any column you want 
Fei
- Mark as New
- Bookmark
- Subscribe
- Mute
- Subscribe to RSS Feed
- Permalink
- Report Inappropriate Content
Thans Tres!!!
This is really a big help.
- Mark as New
- Bookmark
- Subscribe
- Mute
- Subscribe to RSS Feed
- Permalink
- Report Inappropriate Content
Thank you so much, It helped me a lot
- « Previous Replies
-
- 1
- 2
- Next Replies »