Unlock a world of possibilities! Login now and discover the exclusive benefits awaiting you.
- Qlik Community
- :
- All Forums
- :
- QlikView App Dev
- :
- Set my own fixed X-axis value in a grid chart?
- Subscribe to RSS Feed
- Mark Topic as New
- Mark Topic as Read
- Float this Topic for Current User
- Bookmark
- Subscribe
- Mute
- Printer Friendly Page
- Mark as New
- Bookmark
- Subscribe
- Mute
- Subscribe to RSS Feed
- Permalink
- Report Inappropriate Content
Set my own fixed X-axis value in a grid chart?
Hi!
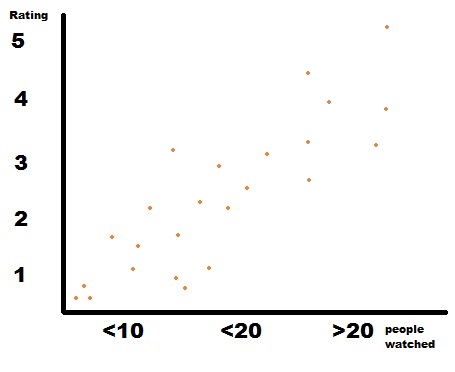
So Im creating this grid-chart and I really want to have the following values in my X-Axis:
- "<10"
- "<20"
- ">20"
I want my graph to look something like the following graph:

The nodes X values does not have the lesser than (<) or bigger than(>) symbols, they are just numbers spanning from 1-30 with no extra characters. Chosing only that field as the x-axis doesnt do it, ofc. I only want those three specified values, containing the symbols (< and >), in the X-axis.
I feel like this should be a simple thing to solve, but I've tried for a while now without any succes...
Sorry about the poor example, hopefully you understand what i'm saying![]()
Any ideas?
Thanks in advance.