Unlock a world of possibilities! Login now and discover the exclusive benefits awaiting you.
- Qlik Community
- :
- All Forums
- :
- QlikView App Dev
- :
- Re: Setting Dimension Limits
- Subscribe to RSS Feed
- Mark Topic as New
- Mark Topic as Read
- Float this Topic for Current User
- Bookmark
- Subscribe
- Mute
- Printer Friendly Page
- Mark as New
- Bookmark
- Subscribe
- Mute
- Subscribe to RSS Feed
- Permalink
- Report Inappropriate Content
Setting Dimension Limits
HI Guys
I have a challenge I hope will be an easy one to resolve.
I have a stacked bar chart with 4 values in it which breaks down how a fund that's been earned is being used.
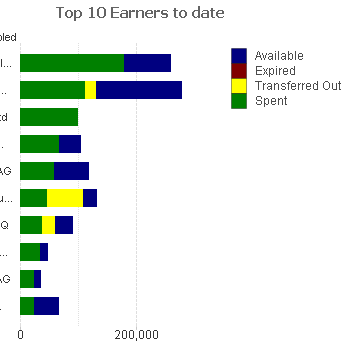
I need to show the top 10 Earners split by how its been used which can be derived 2 ways
1. Available + Expired + Transferred Out + Spent
Or
2. Earned + Transferred In
I have tried including Earned + Transferred In as the first expression and setting it to invisible but it still takes up space on the chart.
How can I get around this?
Regards
Andy
Accepted Solutions
- Mark as New
- Bookmark
- Subscribe
- Mute
- Subscribe to RSS Feed
- Permalink
- Report Inappropriate Content
hi,
use calculated dimension:
=If(Aggr(Rank(Sum(Dim)), Dim) <= 10, Dim)
- Mark as New
- Bookmark
- Subscribe
- Mute
- Subscribe to RSS Feed
- Permalink
- Report Inappropriate Content
You can try with Dimension Limit option in the chart rite?
or you can try with the Rank function
...please share your file will , which will give idea what your data and what your trying
- Mark as New
- Bookmark
- Subscribe
- Mute
- Subscribe to RSS Feed
- Permalink
- Report Inappropriate Content
I cannot share the chart as client sensitive data. Hence the screen shot and description of the data involved.
I have tried the dimension limit. The issue is it using the first expression in this case that would be spent but I need to using a different expression which is Earned to derive the limit but cannot be displayed in the chart.
- Mark as New
- Bookmark
- Subscribe
- Mute
- Subscribe to RSS Feed
- Permalink
- Report Inappropriate Content
hi,
use calculated dimension:
=If(Aggr(Rank(Sum(Dim)), Dim) <= 10, Dim)
- Mark as New
- Bookmark
- Subscribe
- Mute
- Subscribe to RSS Feed
- Permalink
- Report Inappropriate Content
Thanks guys using the calculated dimension helped get to the bottom of my issue.
Regards
Andy