Unlock a world of possibilities! Login now and discover the exclusive benefits awaiting you.
- Qlik Community
- :
- All Forums
- :
- QlikView App Dev
- :
- Re: Show 12 months when One month is selected
- Subscribe to RSS Feed
- Mark Topic as New
- Mark Topic as Read
- Float this Topic for Current User
- Bookmark
- Subscribe
- Mute
- Printer Friendly Page
- Mark as New
- Bookmark
- Subscribe
- Mute
- Subscribe to RSS Feed
- Permalink
- Report Inappropriate Content
Show 12 months when One month is selected
I have a chart trying to show the last 12 months beginning with the month I select. My current dimension is MonthYear.
My expression is sum({<MonthYear=>}[MACHINE HOURS])* avg({<MonthYear=>}[WORK PCT]/100)
I have it down to ignore the month year I select to show past months. But my chart keeps showing from Jun 2017 back to Feb 2016. How can I have the chart show all 12 months starting with my selected monthyear.
- « Previous Replies
-
- 1
- 2
- Next Replies »
- Mark as New
- Bookmark
- Subscribe
- Mute
- Subscribe to RSS Feed
- Permalink
- Report Inappropriate Content
That is strange, would you be able to share a sample?
- Mark as New
- Bookmark
- Subscribe
- Mute
- Subscribe to RSS Feed
- Permalink
- Report Inappropriate Content
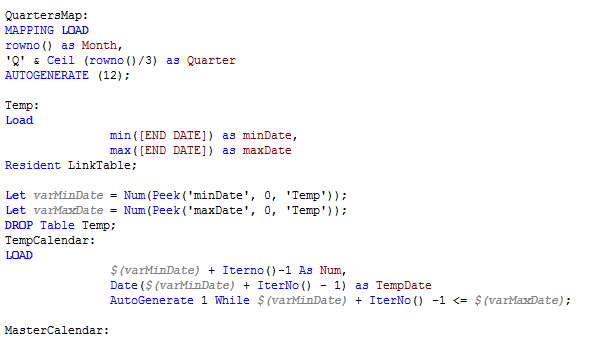
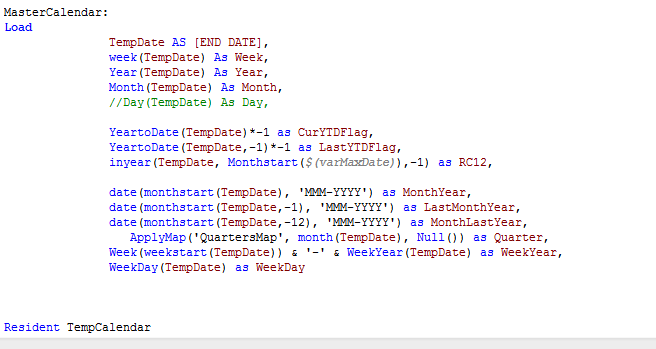
I cant share the qvd due to privacy but I have added some screenshots. I need to have my other graphs remain as is. So i cant touch the master calendar to much. In the bar graph I use dimension Monthyear.
Then My expression is :

And my Calendar:
- Mark as New
- Bookmark
- Subscribe
- Mute
- Subscribe to RSS Feed
- Permalink
- Report Inappropriate Content
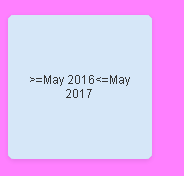
Can you post a screenshot of this expression in a text box object?
='>=' & Date(AddMonths(Max(MonthYear), -12), 'MMM YYYY') & '<=' & Date(Max(MonthYear), 'MMM YYYY')
- Mark as New
- Bookmark
- Subscribe
- Mute
- Subscribe to RSS Feed
- Permalink
- Report Inappropriate Content
- Mark as New
- Bookmark
- Subscribe
- Mute
- Subscribe to RSS Feed
- Permalink
- Report Inappropriate Content
If this is what you see, I won't really know what you might be doing wrong because that proves to me that you should only see from May 2016 to May 2017 (assuming you have selected May 2017 or May 2017 is your max date.....
- Mark as New
- Bookmark
- Subscribe
- Mute
- Subscribe to RSS Feed
- Permalink
- Report Inappropriate Content
Can you help with writing it into my expression:
sum({<MonthYear=>}[MACHINE HOURS])* avg({<MonthYear=>}[WORK PCT]/100)
- Mark as New
- Bookmark
- Subscribe
- Mute
- Subscribe to RSS Feed
- Permalink
- Report Inappropriate Content
That is what I was trying to do  .... But I don't really know how your data is set
- « Previous Replies
-
- 1
- 2
- Next Replies »