Unlock a world of possibilities! Login now and discover the exclusive benefits awaiting you.
- Qlik Community
- :
- All Forums
- :
- QlikView App Dev
- :
- Re: Show All Values of Bucket in Cross Tab
- Subscribe to RSS Feed
- Mark Topic as New
- Mark Topic as Read
- Float this Topic for Current User
- Bookmark
- Subscribe
- Mute
- Printer Friendly Page
- Mark as New
- Bookmark
- Subscribe
- Mute
- Subscribe to RSS Feed
- Permalink
- Report Inappropriate Content
Show All Values of Bucket in Cross Tab
Hi All,
I have created a bucket by comparing a measure value (measure1) with below logic and I am using this Bucket as a dimension in pivot table. Now the issue is i am getting only those buckets for which i have some value of measure. Is there a way i can show all values of buckets even if we dont have any measure value. Show All values is coming disabled in this case.
[Bucket Table]:
LOAD * INLINE [
Low,High,Value
0,10,0%-10%
10,20,20%
20,30,30%
30,40,40%
40,50,50%
50,60,60%
60,70,70%
70,80,80%
80,90,90%
90,100,100%
];
Let vLow1 = Peek('Low',0);
Let vLow2 = Peek('Low',1);
Let vLow3 = Peek('Low',2);
Let vLow4 = Peek('Low',3);
Let vLow5 = Peek('Low',4);
Let vLow6 = Peek('Low',5);
Let vLow7 = Peek('Low',6);
Let vLow8 = Peek('Low',7);
Let vLow9 = Peek('Low',8);
Let vLow10 = Peek('Low',9);
Let vHigh1 = Peek('High',0);
Let vHigh2 = Peek('High',1);
Let vHigh3 = Peek('High',2);
Let vHigh4 = Peek('High',3);
Let vHigh5 = Peek('High',4);
Let vHigh6 = Peek('High',5);
Let vHigh7 = Peek('High',6);
Let vHigh8 = Peek('High',7);
Let vHigh9 = Peek('High',8);
Let vHigh10 = Peek('High',9);
Let vBucket1 = Peek('Value',0);
Let vBucket2 = Peek('Value',1);
Let vBucket3 = Peek('Value',2);
Let vBucket4 = Peek('Value',3);
Let vBucket5 = Peek('Value',4);
Let vBucket6 = Peek('Value',5);
Let vBucket7 = Peek('Value',6);
Let vBucket8 = Peek('Value',7);
Let vBucket9 = Peek('Value',8);
Let vBucket10 = Peek('Value',9);
Chart Bucket Formula:
if(Measure1>vLow1 and Measure1<=vHigh1, vBucket1,
if(Measure1>vLow2 and Measure1<=vHigh2, vBucket2,
if(Measure1>vLow3 and Measure1<=vHigh3, vBucket3,
if(Measure1>vLow4 and Measure1<=vHigh4, vBucket4,
if(Measure1>vLow5 and Measure1<=vHigh5, vBucket5,
if(Measure1>vLow6 and Measure1<=vHigh6, vBucket6,
if(Measure1>vLow7 and Measure1<=vHigh7, vBucket7,
if(Measure1>vLow8 and Measure1<=vHigh8, vBucket8,
if(Measure1>vLow9 and Measure1<=vHigh9, vBucket9,
vBucket10
)))))))))
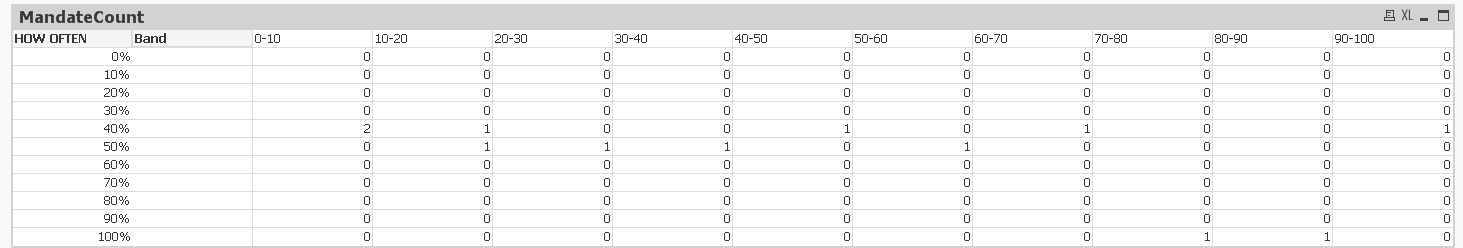
Field " How Often" is in question here..
Present Scenario:

Expected Scenario:
| HOW OFTEN | Band | 0-10 | 20-Oct | 20-30 | 30-40 | 40-50 | 50-60 | 60-70 | 70-80 | 80-90 | 90-100 |
| 0-10% | |||||||||||
| 20% | |||||||||||
| 30% | |||||||||||
| 40% | 2 | 1 | - | - | 1 | - | 1 | - | - | 1 | |
| 50% | - | 1 | 1 | 1 | - | 1 | - | - | - | - | |
| 60% | |||||||||||
| 70% | |||||||||||
| 80% | |||||||||||
| 90% | |||||||||||
| 100% | - | - | - | - | - | - | - | 1 | 1 | - |
- « Previous Replies
-
- 1
- 2
- Next Replies »
- Mark as New
- Bookmark
- Subscribe
- Mute
- Subscribe to RSS Feed
- Permalink
- Report Inappropriate Content
Ok. Let me explain in more detail way.
I am trying to move forward with the solution you provided but the hurdle I am facing is that we have to drill down the COUNT( a measure which we are trying to show against two dimension) into the details of the entity which we are counting.
So we are showing count as 2 n if we click 2 than it should show me table/chart with names and further details of those 2 entities.
But I understood here that in a cross table/Pivot table in qlikview drill down is possible through Dimensions only( " How OFten" and "Band" in this case not" Mandate Count.
so functionality should be like this :
we get this table as first view:
and when click "2" under Band 0-10 with row as 40% , it should give me the details of those "2" counts as in 2 distinct rows but I am getting 0 rows.
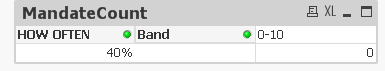
by clicking 2 I am hiding the first table n showing another table with those 2 records but those 2 records are not coming as it shows 0.
Could you please help me on in this. really appreciate your inputs on this.
Workaround to this would I can only sell this chart to business by asking them to select 40% first n than see the 2 rows which is one more extra step for them.
- Mark as New
- Bookmark
- Subscribe
- Mute
- Subscribe to RSS Feed
- Permalink
- Report Inappropriate Content
Rather than going with this much big formula,
can't we use intervalmatch?
- Mark as New
- Bookmark
- Subscribe
- Mute
- Subscribe to RSS Feed
- Permalink
- Report Inappropriate Content
we have to calculate this on dynamic basis. Calculation is based on selection of some values in a list box. Plz refer above qvws for more information.
- Mark as New
- Bookmark
- Subscribe
- Mute
- Subscribe to RSS Feed
- Permalink
- Report Inappropriate Content
Check now
- « Previous Replies
-
- 1
- 2
- Next Replies »