Unlock a world of possibilities! Login now and discover the exclusive benefits awaiting you.
- Qlik Community
- :
- All Forums
- :
- QlikView App Dev
- :
- Re: Show Date dimension even when no value present
- Subscribe to RSS Feed
- Mark Topic as New
- Mark Topic as Read
- Float this Topic for Current User
- Bookmark
- Subscribe
- Mute
- Printer Friendly Page
- Mark as New
- Bookmark
- Subscribe
- Mute
- Subscribe to RSS Feed
- Permalink
- Report Inappropriate Content
Show Date dimension even when no value present
Hi guys,
Trying to create a bar graph to show performance over last 12 months.
Result is correct when no selection is made
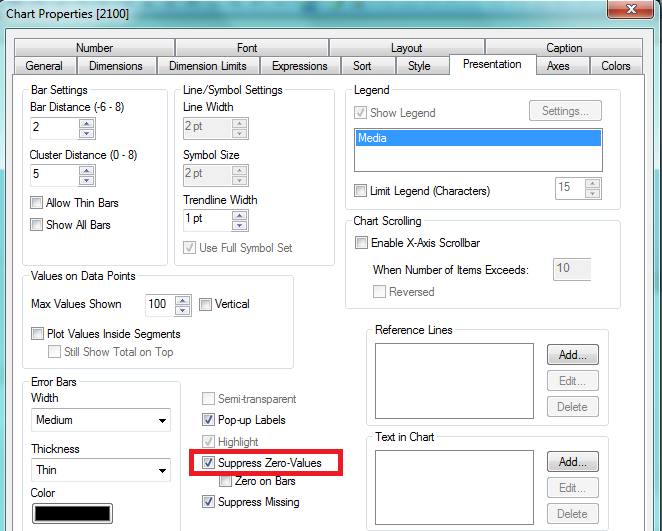
But when I make a selection on the currency, Month with zero values disappear.
How do I make it that zero values appear even if I make a selection?
Cheers.
- « Previous Replies
-
- 1
- 2
- Next Replies »
Accepted Solutions
- Mark as New
- Bookmark
- Subscribe
- Mute
- Subscribe to RSS Feed
- Permalink
- Report Inappropriate Content
- Mark as New
- Bookmark
- Subscribe
- Mute
- Subscribe to RSS Feed
- Permalink
- Report Inappropriate Content
Hi Kim:
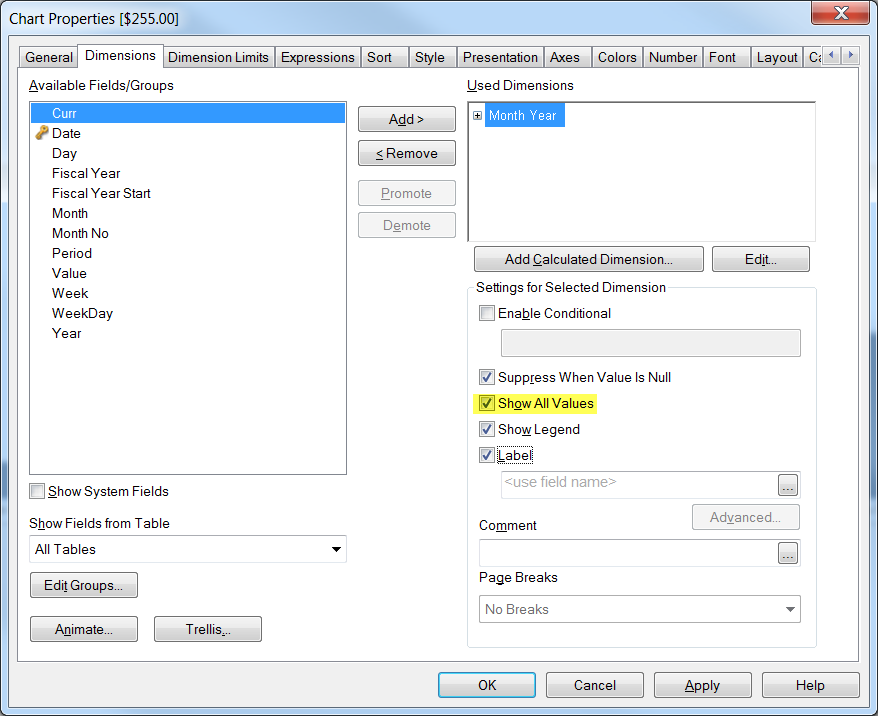
You can check the box with "Show All Values" for the dimension.

-- Shafi
- Mark as New
- Bookmark
- Subscribe
- Mute
- Subscribe to RSS Feed
- Permalink
- Report Inappropriate Content
Hi Ahammad,
Did that and it did showed all but what if I want to limit it to the last 12 months like what I did on the expressions tab?
=num(SUM({<[Date] = {">=$(v12MonthStart) <=$(v12MonthEnd)"}>}[Value]), '$#,##0.##')
Cheers
- Mark as New
- Bookmark
- Subscribe
- Mute
- Subscribe to RSS Feed
- Permalink
- Report Inappropriate Content
Dear Concern,
Try This,

- Mark as New
- Bookmark
- Subscribe
- Mute
- Subscribe to RSS Feed
- Permalink
- Report Inappropriate Content
Try this, hope this helps.
- Mark as New
- Bookmark
- Subscribe
- Mute
- Subscribe to RSS Feed
- Permalink
- Report Inappropriate Content
Hi Shivesh,
I would want to show the last 12 months. Is there a way to do this?
Regards,
- Mark as New
- Bookmark
- Subscribe
- Mute
- Subscribe to RSS Feed
- Permalink
- Report Inappropriate Content
Hi Ashwini,
This would work if I did not select a Currency. Once I select a value from currency this does not work anymore.
Regards,
- Mark as New
- Bookmark
- Subscribe
- Mute
- Subscribe to RSS Feed
- Permalink
- Report Inappropriate Content
Hi Kim,
Try the sample attached.
I have simple updated your variable for my reference, you can revert them.
I have created a new filed called as counter , which have value 1.
Then created a new expression and disable the chart type.
Br,
KC
KC
- Mark as New
- Bookmark
- Subscribe
- Mute
- Subscribe to RSS Feed
- Permalink
- Report Inappropriate Content
Hi KC,
Thanks for this. But what if I only want to display 12 months of data only? Like for the past 12 months?
Regards,
- Mark as New
- Bookmark
- Subscribe
- Mute
- Subscribe to RSS Feed
- Permalink
- Report Inappropriate Content
Same logic, just change your variables as it was earlier.
I just modified it for my reference ![]()
KC
- « Previous Replies
-
- 1
- 2
- Next Replies »