Unlock a world of possibilities! Login now and discover the exclusive benefits awaiting you.
- Qlik Community
- :
- All Forums
- :
- QlikView App Dev
- :
- Show Distinct Values in Chart
- Subscribe to RSS Feed
- Mark Topic as New
- Mark Topic as Read
- Float this Topic for Current User
- Bookmark
- Subscribe
- Mute
- Printer Friendly Page
- Mark as New
- Bookmark
- Subscribe
- Mute
- Subscribe to RSS Feed
- Permalink
- Report Inappropriate Content
Show Distinct Values in Chart
Hello,
I created this chart as below. The data model was built from two tables "Case" and "Report", linked with Case_ID as primary key. Case_ID and Report_ID are dimensions, the rest of data fields are expressions.
Since there are NULL values in the Case_ID, so I have the expression =If (not IsNull([Case Number]) AND not isnull(Report_ID),[Case Number]) for Case_ID.
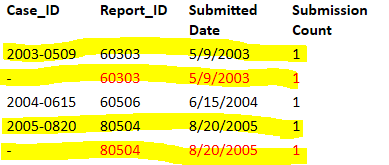
There are duplicated values in "Report_ID" field. I wasn't sure why those duplicated values exsit as there is no duplicated value in the table "Report". I would like only show distinct values which not only the chart will look better and clean, as well as I will have an accurate values in "Submission Count".
| Case_ID | Report_ID | Submitted Date | Submission Count |
| 2003-0509 | 60303 | 5/9/2003 | 1 |
| - | 60303 | 5/9/2003 | 1 |
| 2004-0615 | 60506 | 6/15/2004 | 1 |
| 2005-0820 | 80504 | 8/20/2005 | 1 |
| - | 80504 | 8/20/2005 | 1 |
tried this in script (while loading data fields from Report table), but doesn't work.
LOAD
Distinct REG_REPORT_ID ,
REG_REPORT_ID as Report_ID.
I am not sure if try =count({$<[Submission Count] = {'1'}>} >} distinct Report_ID) would work for this case. Becuase I also want to eliminate those duplicated rows.
What will be your suggestion to help me solve this issue?
Thanks for your help in advance,
Becky
- « Previous Replies
-
- 1
- 2
- Next Replies »
Accepted Solutions
- Mark as New
- Bookmark
- Subscribe
- Mute
- Subscribe to RSS Feed
- Permalink
- Report Inappropriate Content
Hi yun,
Why do you have same report_id on one null case and one not null case?
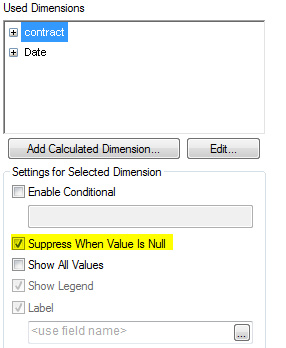
I suggest you to hide null values:

Regards!
- Mark as New
- Bookmark
- Subscribe
- Mute
- Subscribe to RSS Feed
- Permalink
- Report Inappropriate Content
Hi Becky,
Can you share your qvw and data files with us ?
- Mark as New
- Bookmark
- Subscribe
- Mute
- Subscribe to RSS Feed
- Permalink
- Report Inappropriate Content
use in chart
aggr(count(DISTINCT if(len(Case_ID)<>0,Case_ID)),Report_ID,SubmittedDate)
- Mark as New
- Bookmark
- Subscribe
- Mute
- Subscribe to RSS Feed
- Permalink
- Report Inappropriate Content
Hi yun,
Why do you have same report_id on one null case and one not null case?
I suggest you to hide null values:

Regards!
- Mark as New
- Bookmark
- Subscribe
- Mute
- Subscribe to RSS Feed
- Permalink
- Report Inappropriate Content
This seems strange when you mention there are no duplicates in your report table. Can you share your application as there may be an issue with any join in your script which is causing the duplicates in your data model.
- Mark as New
- Bookmark
- Subscribe
- Mute
- Subscribe to RSS Feed
- Permalink
- Report Inappropriate Content
Thank you Manuel,
I have the same Report_ID on one null case and one not null case? ...Where I did it?
I remember that I tried "Suppress When value is Null" but doesn't work that time.
But I am glad it working now.
Best,
Becky
- Mark as New
- Bookmark
- Subscribe
- Mute
- Subscribe to RSS Feed
- Permalink
- Report Inappropriate Content
Hello,
I'm guessing that it's only in the Report source table you have null Case_ID. If so I would load your Report table with the line
Load
.
.
if(isnull(Case_ID),'Missing', Case_ID) as Case_ID
.
.
Then you can select 'Missing' as Case_ID and you can investigate the Reports that have no associated Case.
Alternatively you can omit these orphans altogether by adding a suitable WHERE clause to your load script for the Reports table. WHERE Exists(Case_ID) will ensure only reports with a case will be loaded.
The biggest problem you have, I would suggest, lies not with the chart but with the source tables.
Good luck
Andrew
- Mark as New
- Bookmark
- Subscribe
- Mute
- Subscribe to RSS Feed
- Permalink
- Report Inappropriate Content
Thanks Brain for your response. I tried Manuel's way just click the "Suppress When value is Null" which didn't work before. Then it works... not duplicated values and no null values...
- Mark as New
- Bookmark
- Subscribe
- Mute
- Subscribe to RSS Feed
- Permalink
- Report Inappropriate Content
Thanks Filip for your response. I tried Manuel's way just click the "Suppress When value is Null" which didn't work before. Then it works... not duplicated values and no null values...
- Mark as New
- Bookmark
- Subscribe
- Mute
- Subscribe to RSS Feed
- Permalink
- Report Inappropriate Content
Hi Yun,

You have 60303 report ID for 2003-0509 Case ID and Null Case ID. The same for 80504 Report ID.
Regards!
- « Previous Replies
-
- 1
- 2
- Next Replies »