Unlock a world of possibilities! Login now and discover the exclusive benefits awaiting you.
- Qlik Community
- :
- All Forums
- :
- QlikView App Dev
- :
- Show Gaps in Line Chart (Multiple Dimensions)
- Subscribe to RSS Feed
- Mark Topic as New
- Mark Topic as Read
- Float this Topic for Current User
- Bookmark
- Subscribe
- Mute
- Printer Friendly Page
- Mark as New
- Bookmark
- Subscribe
- Mute
- Subscribe to RSS Feed
- Permalink
- Report Inappropriate Content
Show Gaps in Line Chart (Multiple Dimensions)
Hi,
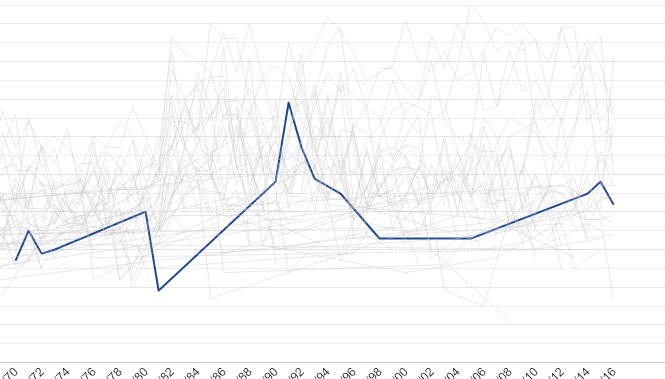
I know this can be done in line charts with single dimensions but is there a way to show gaps in line charts where data is missing? I've created a chart that compares performance over weeks to that of their rivals/competition. Some weeks, users might not participate and I want to represent that a gaps in the line. Below is what I have at the minute.
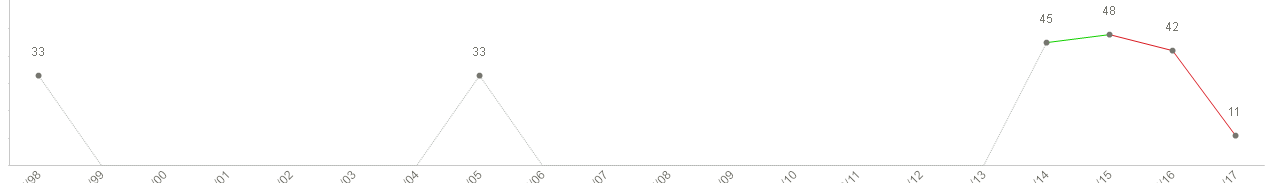
But I want something more like this:
Is there a way to accomplish this and keeping the background data in grey without layering one chart over another?
- Tags:
- chart
- gap
- line chart
- Mark as New
- Bookmark
- Subscribe
- Mute
- Subscribe to RSS Feed
- Permalink
- Report Inappropriate Content
Maybe using the forecolor property of the expression and a condition that paints the line in light gray if the current value or next value is null.
I suggest that you post a small sample containing some data and the object in question for more specific help.
- Mark as New
- Bookmark
- Subscribe
- Mute
- Subscribe to RSS Feed
- Permalink
- Report Inappropriate Content
You'll need to create a Master Calendar that includes "all" dates and relate that to your date stamps in your data. No data for any point in time, with the Dimension as your Master Calendar date, would present "breaks" in the line.