Unlock a world of possibilities! Login now and discover the exclusive benefits awaiting you.
- Qlik Community
- :
- All Forums
- :
- QlikView App Dev
- :
- Re: Show/Hide Columns of Graph Based of a List
- Subscribe to RSS Feed
- Mark Topic as New
- Mark Topic as Read
- Float this Topic for Current User
- Bookmark
- Subscribe
- Mute
- Printer Friendly Page
- Mark as New
- Bookmark
- Subscribe
- Mute
- Subscribe to RSS Feed
- Permalink
- Report Inappropriate Content
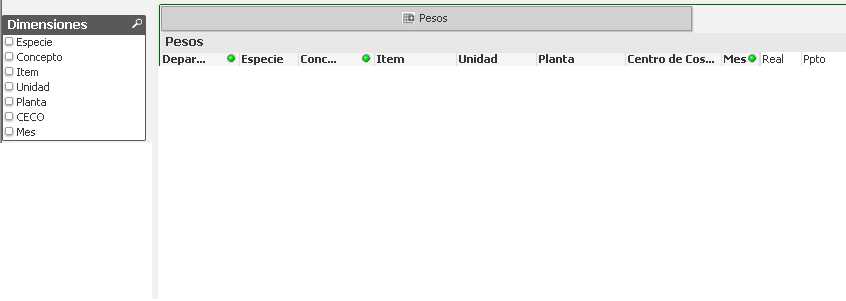
Show/Hide Columns of Graph Based of a List
Hi
I have a pivot table and I want to hide/show some columns based on a selection of a field.
I'm using this expression to hide/show them:
=Substringcount(','&concat(distinct Dimensiones, ',')&',', ',Especie,')=1
The trouble is that when I UnSelect All, all the columns appears, and I need that they appear only if selected.
In other words, as default, columns should be hide.
Any idea? Thanks!!
Accepted Solutions
- Mark as New
- Bookmark
- Subscribe
- Mute
- Subscribe to RSS Feed
- Permalink
- Report Inappropriate Content
Solved!
=if(GetSelectedCount(Columnas)=0,0,Substringcount(','&concat(distinct Columnas, ',')&',', ',Especie,')=1)
- Mark as New
- Bookmark
- Subscribe
- Mute
- Subscribe to RSS Feed
- Permalink
- Report Inappropriate Content
Solved!
=if(GetSelectedCount(Columnas)=0,0,Substringcount(','&concat(distinct Columnas, ',')&',', ',Especie,')=1)
- Mark as New
- Bookmark
- Subscribe
- Mute
- Subscribe to RSS Feed
- Permalink
- Report Inappropriate Content
Hi KJH,
I hope you are asking in Ad-hoc Reporting concept?
any way you got the solution as per your expectations so please close the thread.