Unlock a world of possibilities! Login now and discover the exclusive benefits awaiting you.
- Qlik Community
- :
- All Forums
- :
- QlikView App Dev
- :
- Re: Show all result with Selected Field
- Subscribe to RSS Feed
- Mark Topic as New
- Mark Topic as Read
- Float this Topic for Current User
- Bookmark
- Subscribe
- Mute
- Printer Friendly Page
- Mark as New
- Bookmark
- Subscribe
- Mute
- Subscribe to RSS Feed
- Permalink
- Report Inappropriate Content
Show all result with Selected Field
We are currently working on a project which deals with vehicle devices associated with a company. Following are the tables and the fields:
Company Table:
ACCOUNT_ID
COMPANY_NAME
COMPANY_PHONE_NUMBER
Device Table
ACCOUNT_ID
DEVICE_ID
A Company can have multiple Devices.
Both of the tables are linked by ACCOUNT_ID.
What we want to do is to show all the Devices associated with the selected customer (by device).
The end user can select the company name or the company phone number or the device.
Regardless of the selection criteria they should be able to see all the devices linked to the customer. For instance the enduser selects device xyz. Device XYZ is associated with Customer ABC – then in the table the list of the all the devices by Customer ABC should be displayed. I tried using set analysis but when I select Device XYZ only XYZ is displayed but it does not show all the devices associated with Customer ABC.
I tried using the following scenario:
1. Chart with Dimension as ACCOUNT_ID
2. Expression =Only({1<[ACCOUNT_ID]={'$(=only([ACCOUNT_ID]))'}>}[DeviceID])
But it did not really work. I think I am missing something very easy.
Will appreciate if someone can assist us.
Thanks.
Accepted Solutions
- Mark as New
- Bookmark
- Subscribe
- Mute
- Subscribe to RSS Feed
- Permalink
- Report Inappropriate Content
- Mark as New
- Bookmark
- Subscribe
- Mute
- Subscribe to RSS Feed
- Permalink
- Report Inappropriate Content
Can you send a example file?
- Mark as New
- Bookmark
- Subscribe
- Mute
- Subscribe to RSS Feed
- Permalink
- Report Inappropriate Content
PFA
- Mark as New
- Bookmark
- Subscribe
- Mute
- Subscribe to RSS Feed
- Permalink
- Report Inappropriate Content
Hello,
Thank you very much for the solution. It is working like a charm. I just hid the expression and now the table is showing my requirement.
This is perfect
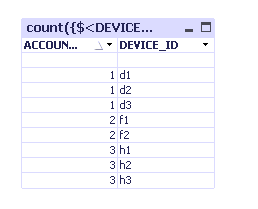
So if i select D1 i get all the devices associated with ACCOUNT_ID 1 - d1/d2/d3
if i select f2 i get the results showing all the associated devices with ACCOUNT_ID 2
Similarly if i select ACCOUNT_ID 1 i get all the related Devices (which is normal behavior)
There is associated phone number also which gives the correct result on the selection.
Can you please explain the following so that I have an understanding.
1. You have two dimensions - Account_ID and Device_ID
2. expression - count({$<DEVICE_ID=P({1 <ACCOUNT_ID=P(ACCOUNT_ID)>} )>} DEVICE_ID)

- Mark as New
- Bookmark
- Subscribe
- Mute
- Subscribe to RSS Feed
- Permalink
- Report Inappropriate Content
Enrique,
Massimo has sent the correct solution. You can view the data which is used in the attached sheet.
Thank.