Unlock a world of possibilities! Login now and discover the exclusive benefits awaiting you.
- Qlik Community
- :
- All Forums
- :
- QlikView App Dev
- :
- Show count of branches where branch value > avg va...
- Subscribe to RSS Feed
- Mark Topic as New
- Mark Topic as Read
- Float this Topic for Current User
- Bookmark
- Subscribe
- Mute
- Printer Friendly Page
- Mark as New
- Bookmark
- Subscribe
- Mute
- Subscribe to RSS Feed
- Permalink
- Report Inappropriate Content
Show count of branches where branch value > avg value?
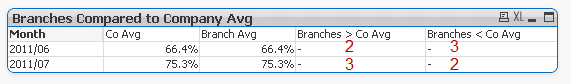
I am trying to figure out how to show a count, by month, of branches whose paid percent is greater/less than that month’s average paid percent (across all branches).
Please see the qvw attached for sample data. If I add branch as a dimension, I can get an individual count. But I can’t figure out how to either roll it up to the month level or (ideally) do it w/o having branch as a dimension since I don't really need it displayed.
What I have:

What I want:
Any suggestions?
Accepted Solutions
- Mark as New
- Bookmark
- Subscribe
- Mute
- Subscribe to RSS Feed
- Permalink
- Report Inappropriate Content
Hi,
use
=count(aggr(if((Sum(total<Branch,Month>Paid)/Sum(total <Branch,Month>Billed))>(Sum (total <Month> Paid) / Sum (total <Month> Billed)),count(distinct Branch)) ,Branch, Month))
as expression for Branches > Co Avg.
Stefan
- Mark as New
- Bookmark
- Subscribe
- Mute
- Subscribe to RSS Feed
- Permalink
- Report Inappropriate Content
That's exactly what I needed - thanks!