Unlock a world of possibilities! Login now and discover the exclusive benefits awaiting you.
- Qlik Community
- :
- All Forums
- :
- QlikView App Dev
- :
- Show last year labels
- Subscribe to RSS Feed
- Mark Topic as New
- Mark Topic as Read
- Float this Topic for Current User
- Bookmark
- Subscribe
- Mute
- Printer Friendly Page
- Mark as New
- Bookmark
- Subscribe
- Mute
- Subscribe to RSS Feed
- Permalink
- Report Inappropriate Content
Show last year labels
Hello,
I have a Bar Chart with two expressions, the first one is showing the bars and the second one only values on data (The labels).
My second expression is:
Alt(
Num(
(Sum({<Year={'$(=Max(Year))'}>} PNC_S) - above(Aggr(Sum({<Year={'$(=Max(Year)-1)'}>} PNC_S), Month, Year)))
/
above(Aggr(Sum({<Year={'$(=Max(Year)-1)'}>} PNC_S), Month, Year))
,'#,%')
,' ')
This is showing the change of PNC between the last two years.
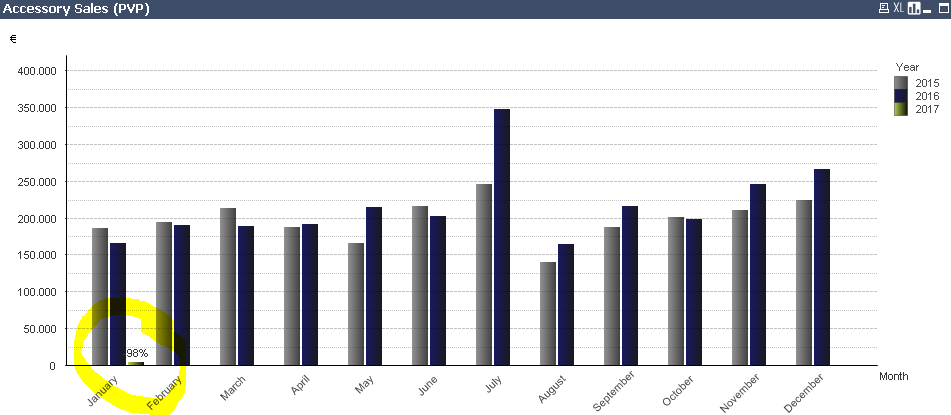
The problem is that it is not showing data from the months where 2017 doesnt exist.
I think a solution would be to evaluate for every month if there is any 2017 data.
- « Previous Replies
-
- 1
- 2
- Next Replies »
- Mark as New
- Bookmark
- Subscribe
- Mute
- Subscribe to RSS Feed
- Permalink
- Report Inappropriate Content
- Mark as New
- Bookmark
- Subscribe
- Mute
- Subscribe to RSS Feed
- Permalink
- Report Inappropriate Content
I dont need to generate new data, I just want to avoid the month/year without data.
- Mark as New
- Bookmark
- Subscribe
- Mute
- Subscribe to RSS Feed
- Permalink
- Report Inappropriate Content
What are the dimensions you have used?
- Mark as New
- Bookmark
- Subscribe
- Mute
- Subscribe to RSS Feed
- Permalink
- Report Inappropriate Content
Month and Year
- Mark as New
- Bookmark
- Subscribe
- Mute
- Subscribe to RSS Feed
- Permalink
- Report Inappropriate Content
May be remove Aggregation with the Month & Year on expression or else you may sure to provide the sample data which demonstrates the output
- Mark as New
- Bookmark
- Subscribe
- Mute
- Subscribe to RSS Feed
- Permalink
- Report Inappropriate Content
So you don't want to show Month where data is not present?
If yes, you can select Month in dimension tab and tick Suppress When Value is null.
If this is not what you are looking for.. Kindly explain briefly.
- Mark as New
- Bookmark
- Subscribe
- Mute
- Subscribe to RSS Feed
- Permalink
- Report Inappropriate Content
I cant remove Aggregation because I have a wider datebase, so It helps me to compare data from same months and different years.
- Mark as New
- Bookmark
- Subscribe
- Mute
- Subscribe to RSS Feed
- Permalink
- Report Inappropriate Content
So, then try Manish latest way or can you describe more for your intend to do with Highlighted one in yellow for your Original post
- Mark as New
- Bookmark
- Subscribe
- Mute
- Subscribe to RSS Feed
- Permalink
- Report Inappropriate Content
Maybe I did not express myself too clear.
I need to show one label for every month. The label has to be the difference between the last 2 years. Like the one highlighted. But, Its only showing the label highlighted. I think its because Its the only month that have 2017 data.
- « Previous Replies
-
- 1
- 2
- Next Replies »