Unlock a world of possibilities! Login now and discover the exclusive benefits awaiting you.
- Qlik Community
- :
- All Forums
- :
- QlikView App Dev
- :
- Show last year labels
- Subscribe to RSS Feed
- Mark Topic as New
- Mark Topic as Read
- Float this Topic for Current User
- Bookmark
- Subscribe
- Mute
- Printer Friendly Page
- Mark as New
- Bookmark
- Subscribe
- Mute
- Subscribe to RSS Feed
- Permalink
- Report Inappropriate Content
Show last year labels
Hello,
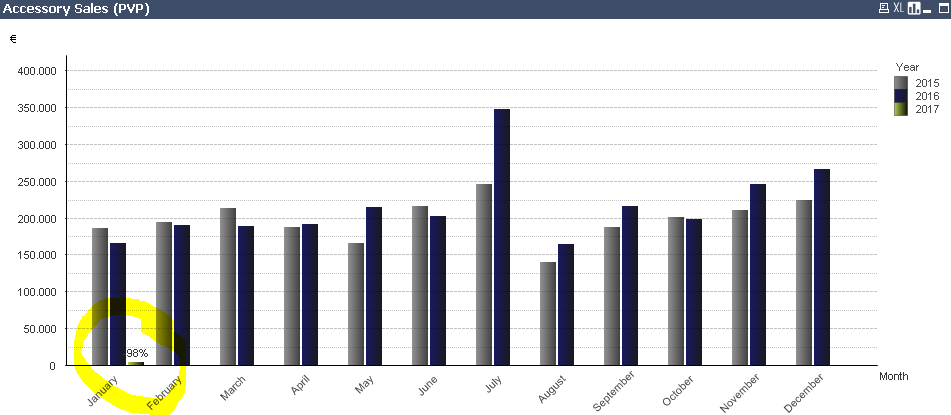
I have a Bar Chart with two expressions, the first one is showing the bars and the second one only values on data (The labels).
My second expression is:
Alt(
Num(
(Sum({<Year={'$(=Max(Year))'}>} PNC_S) - above(Aggr(Sum({<Year={'$(=Max(Year)-1)'}>} PNC_S), Month, Year)))
/
above(Aggr(Sum({<Year={'$(=Max(Year)-1)'}>} PNC_S), Month, Year))
,'#,%')
,' ')
This is showing the change of PNC between the last two years.
The problem is that it is not showing data from the months where 2017 doesnt exist.
I think a solution would be to evaluate for every month if there is any 2017 data.
- « Previous Replies
-
- 1
- 2
- Next Replies »
- Mark as New
- Bookmark
- Subscribe
- Mute
- Subscribe to RSS Feed
- Permalink
- Report Inappropriate Content
I need to show one label for every month. The label has to be the difference between the last 2 years. Like the one highlighted. But, Its only showing the label highlighted. I think its because Its the only month that have 2017 data.
- Mark as New
- Bookmark
- Subscribe
- Mute
- Subscribe to RSS Feed
- Permalink
- Report Inappropriate Content
Make sense, Now Turns to questions
1) Do you have Forecast data for 2017?
2) If so, It should show labels for each month
3) If not, You will get only for January because data set may have only for January. Would it be cause it is not showing for another months.
If possible, Can you post the application to work on it the same
- Mark as New
- Bookmark
- Subscribe
- Mute
- Subscribe to RSS Feed
- Permalink
- Report Inappropriate Content
I dont have any forecast for 2017 and I cant post the application due to company rules.
I think a way to solve this would be to evaluate the month. If that month does not have any data becouse of the year, just subtract 1.
But I do not know how to evaluate that.
- Mark as New
- Bookmark
- Subscribe
- Mute
- Subscribe to RSS Feed
- Permalink
- Report Inappropriate Content
can you please post with a dummy data want all the company needs there data o be secured but we can prepare a dummy data and post it in community for the solution
- « Previous Replies
-
- 1
- 2
- Next Replies »