Unlock a world of possibilities! Login now and discover the exclusive benefits awaiting you.
- Qlik Community
- :
- All Forums
- :
- QlikView App Dev
- :
- Show only Total for Dimension in line chart
- Subscribe to RSS Feed
- Mark Topic as New
- Mark Topic as Read
- Float this Topic for Current User
- Bookmark
- Subscribe
- Mute
- Printer Friendly Page
- Mark as New
- Bookmark
- Subscribe
- Mute
- Subscribe to RSS Feed
- Permalink
- Report Inappropriate Content
Show only Total for Dimension in line chart
I have a line chart showing year over year growth by month, and I would like for the values on data points to show only the total for prior years or YTD for current year. I have researched in several other threads that are similar, but don't quite fit my situation so the solutions aren't working for me.
For the chart below, I want the zeros to disappear, and the numbers on the far right should be the cumulative total for the year. For the current year, i would like the value to show the current YTD total.
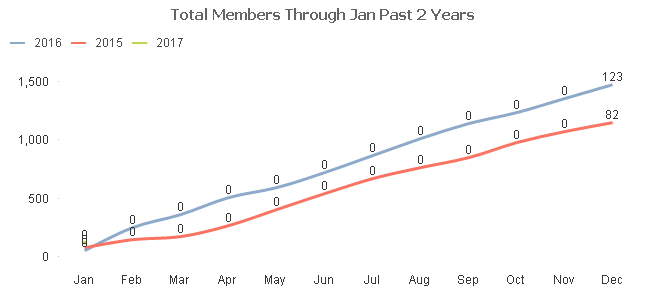
I have attached an example. Thanks for your help.
Accepted Solutions
- Mark as New
- Bookmark
- Subscribe
- Mute
- Subscribe to RSS Feed
- Permalink
- Report Inappropriate Content
- Mark as New
- Bookmark
- Subscribe
- Mute
- Subscribe to RSS Feed
- Permalink
- Report Inappropriate Content
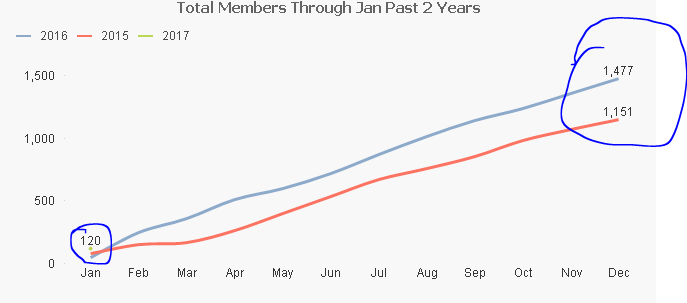
Like this?
- Mark as New
- Bookmark
- Subscribe
- Mute
- Subscribe to RSS Feed
- Permalink
- Report Inappropriate Content
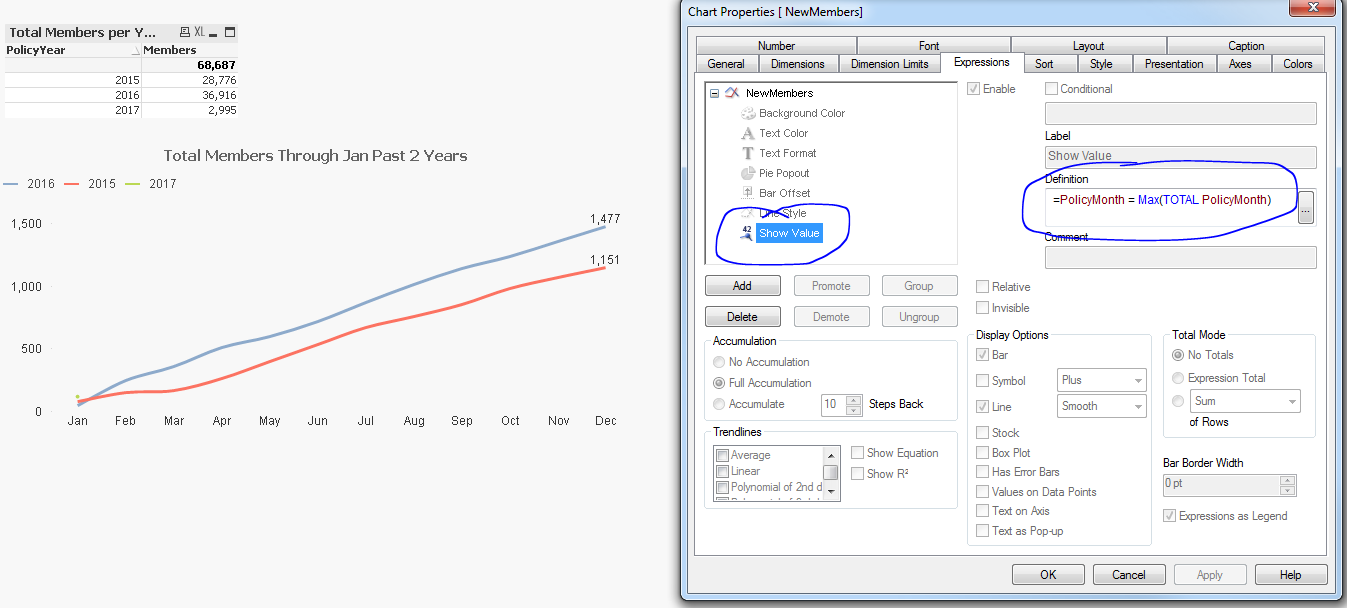
Or this:
=PolicyMonth = Max(TOTAL <PolicyYear> PolicyMonth)
- Mark as New
- Bookmark
- Subscribe
- Mute
- Subscribe to RSS Feed
- Permalink
- Report Inappropriate Content
That's it! I forgot about the 'Show Values' option. Thanks!!