Unlock a world of possibilities! Login now and discover the exclusive benefits awaiting you.
- Qlik Community
- :
- All Forums
- :
- QlikView App Dev
- :
- Re: Show only complete MAT periods in chart
- Subscribe to RSS Feed
- Mark Topic as New
- Mark Topic as Read
- Float this Topic for Current User
- Bookmark
- Subscribe
- Mute
- Printer Friendly Page
- Mark as New
- Bookmark
- Subscribe
- Mute
- Subscribe to RSS Feed
- Permalink
- Report Inappropriate Content
Show only complete MAT periods in chart
Hi, I'm new to QV, and I have no scripting abilities, but I have to deliver a chart showing the MAT monthly sales figure.
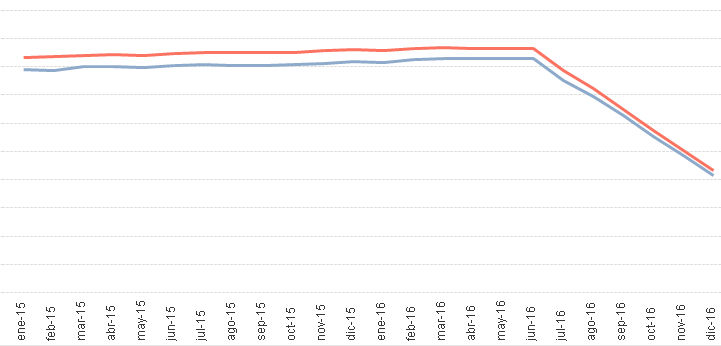
I've already achieved the MAT calculation using an AsOf table, and have the chart plotted:

The problem is that it shows incomplete MAT periods (i.e. as I only have data until June-16, the following months have just 11, 10, 9, 8... months of sales data). As these MAT periods are not complete, I want to remove them from the chart.
Any clues how to do this?
Thanks for your help!
- Mark as New
- Bookmark
- Subscribe
- Mute
- Subscribe to RSS Feed
- Permalink
- Report Inappropriate Content
What is the expression that you have used?
- Mark as New
- Bookmark
- Subscribe
- Mute
- Subscribe to RSS Feed
- Permalink
- Report Inappropriate Content
Hi Sunny,
In the AsOf table, each month is related to the corresponding MAT period. I'm using the MAT period as dimensión, so the expression is just a SUM function of the sales amount: sum(VI)
Hope this helps,
BR