Unlock a world of possibilities! Login now and discover the exclusive benefits awaiting you.
- Qlik Community
- :
- All Forums
- :
- QlikView App Dev
- :
- Re: Show total row wise in pivot table
- Subscribe to RSS Feed
- Mark Topic as New
- Mark Topic as Read
- Float this Topic for Current User
- Bookmark
- Subscribe
- Mute
- Printer Friendly Page
- Mark as New
- Bookmark
- Subscribe
- Mute
- Subscribe to RSS Feed
- Permalink
- Report Inappropriate Content
Show total row wise in pivot table
I have a pivot table which shows the count of test cases and I'm showing it horizontally.
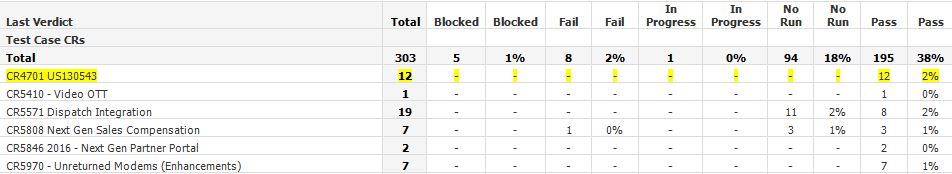
(image from an excel export)
I want to show the percentage row wise. Instead, it is calculating the percentage column-wise.
For example, in CR4701 US130543 there are 12 test cases and all of them are in Pass state. So the pass percentage should be 100%. Instead, it is calculating the percentage by taking all the 'Pass' test cases i.e. 195 [(12/195)*100]. It should calculate only for that particular CR.
Is there any way to do that? I hope I have made my requirement clear.
Expression for count:
count(TestCaseID)
Expression for Percentage:
count(TestCaseID)/count(total(TestCaseID))
(I think for the % expression, the denominator is wrong.)
Thanks,
YASH
- « Previous Replies
-
- 1
- 2
- Next Replies »
- Mark as New
- Bookmark
- Subscribe
- Mute
- Subscribe to RSS Feed
- Permalink
- Report Inappropriate Content
Hi,
Try this.
count(TestCaseID)/count(total<TestCaseCRs>(TestCaseID))
Regards,
Kaushik Solanki
- Mark as New
- Bookmark
- Subscribe
- Mute
- Subscribe to RSS Feed
- Permalink
- Report Inappropriate Content
Hi Kaushik....this expression did not work.
- Mark as New
- Bookmark
- Subscribe
- Mute
- Subscribe to RSS Feed
- Permalink
- Report Inappropriate Content
May be these:
Count(TestCaseID)/Count(total <DIM1> TestCaseID)
or
Count(TestCaseID)/Count(total <DIM1, DIM2> TestCaseID)
or
if(dimensionality()=0, Count(TestCaseID)/Count(total <DimA> TestCaseID), sum(TestCaseID)) // (Think so)
- Mark as New
- Bookmark
- Subscribe
- Mute
- Subscribe to RSS Feed
- Permalink
- Report Inappropriate Content
Would you be able to share the sample file?
- Mark as New
- Bookmark
- Subscribe
- Mute
- Subscribe to RSS Feed
- Permalink
- Report Inappropriate Content
- Mark as New
- Bookmark
- Subscribe
- Mute
- Subscribe to RSS Feed
- Permalink
- Report Inappropriate Content
I'm not able to find the option to attach .qvw. Drag and drop also didnt work
- Mark as New
- Bookmark
- Subscribe
- Mute
- Subscribe to RSS Feed
- Permalink
- Report Inappropriate Content
Hi Bala..i tried this expression but it didnt work. Kaushik had already asked me to try it.
thanks..
- Mark as New
- Bookmark
- Subscribe
- Mute
- Subscribe to RSS Feed
- Permalink
- Report Inappropriate Content
Hi,
See the attached app.
Regards,
Kaushik Solanki
- Mark as New
- Bookmark
- Subscribe
- Mute
- Subscribe to RSS Feed
- Permalink
- Report Inappropriate Content
Look here
- « Previous Replies
-
- 1
- 2
- Next Replies »